
MindTap Business Statistics, 1 term (6 months) Printed Access Card for Anderson/Sweeney/Williams/Camm/Cochran's Essentials of Statistics for Business and Economics, 8th
8th Edition
ISBN: 9781337114288
Author: Anderson, David R.; Sweeney, Dennis J.; Williams, Thomas A.; Camm, Jeffrey D.; Cochran, James J.
Publisher: Cengage Learning
expand_more
expand_more
format_list_bulleted
Concept explainers
Videos
Textbook Question
Chapter 15, Problem 53SE
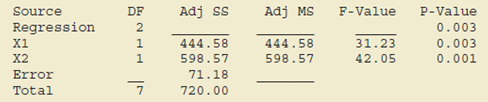
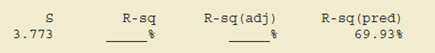
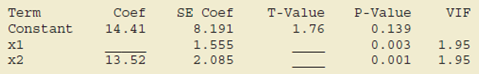
Recall that in exercise 50 the personnel director for Electronics Associates developed the following estimated regression equation relating an employee’s score on a job satisfaction test to length of service and wage rate.
ŷ = 14.41 − 8.69x1 1 13.52x2
where
x1 = length of service (years)
x2 = wage rate (dollars)
y = job satisfaction test score (higher scores indicate greater job satisfaction)
A portion of the Minitab computer output follows.
Analysis of Variance
Model Summary
Coefficients
Regression Equation
y = 14.41 − 8.69 X1 + 13.52 X2
- a. Complete the missing entries in this output.
- b. Compute F and test using α = .05 to see whether a significant relationship is present.
- c. Did the estimated regression equation provide a good fit to the data? Explain.
- d. Use the t test and α = .05 to test H0: α1 = 0 and H0: β2 = 0.
Expert Solution & Answer
Want to see the full answer?
Check out a sample textbook solution
Students have asked these similar questions
The personnel director for Electronics Associates developed the following estimated regression equation relating an employee's score on a job satisfaction test to his or her length of service and wage rate.y-hat = 14.4 - 8.69x1 +13.5x2
where:
x1 = length of service (years)x2 = wage rate (dollars)y = job satisfaction test score (higher scoresindicate greater job satisfaction)Round your answers to 2 decimal places.
a. Interpret the coefficients in this estimated regression equation.
If the wage rate does not change, a one-year increase in length of service is associated with - Select your answer - in job satisfaction score by _______________ units. If the length of service does not change, a dollar increase in wage results in - Select your answer - in job satisfaction score by _______________ units.
b. Predict the job satisfaction test score for an employee who has four years of service and makes $6.50 per hour. _________________
It is considered that the number of employees in the enterprise affects the number of production. Data are given below. Which of the following is the simple linear regression equation?
The manager of the Bayville police department motor pool wants to develop a forecast model for annual maintenance on police cars, based on mileage in the past year and age of the cars. The following data have been collected for eight different cars: a. Using Excel, develop a multiple regression equation for these data. b. What is the coefficient of determination for this regression equation? c. Forecast the annual maintenance cost for a police car that is 5 years old and will be driven 10,000 miles in 1 year.
Chapter 15 Solutions
MindTap Business Statistics, 1 term (6 months) Printed Access Card for Anderson/Sweeney/Williams/Camm/Cochran's Essentials of Statistics for Business and Economics, 8th
Ch. 15.2 - The estimated regression equation for a model...Ch. 15.2 - Prob. 2ECh. 15.2 - 3. In a regression analysis involving 30...Ch. 15.2 - A shoe store developed the following estimated...Ch. 15.2 - Prob. 5ECh. 15.2 - NFL Winning Percentage. The National Football...Ch. 15.2 - Rating Computer Monitors. PC Magazine provided...Ch. 15.2 - Scoring Cruise Ships. The Condé Nast Traveler Gold...Ch. 15.2 - Prob. 9ECh. 15.2 - Baseball Pitcher Performance. Major League...
Ch. 15.3 - In exercise 1, the following estimated regression...Ch. 15.3 - Prob. 12ECh. 15.3 - 13. In exercise 3, the following estimated...Ch. 15.3 - In exercise 4, the following estimated regression...Ch. 15.3 - Prob. 15ECh. 15.3 - 16. In exercise 6, data were given on the average...Ch. 15.3 - Prob. 17ECh. 15.3 - R2 in Predicting Baseball Pitcher Performance....Ch. 15.5 - In exercise 1, the following estimated regression...Ch. 15.5 - Prob. 20ECh. 15.5 - The following estimated regression equation was...Ch. 15.5 - Testing Significance in Shoe Sales Prediction. In...Ch. 15.5 - Testing Significance in Theater Revenue. Refer to...Ch. 15.5 - Testing Significance in Predicting NFL Wins. The...Ch. 15.5 - Prob. 25ECh. 15.5 - Testing Significance in Baseball Pitcher...Ch. 15.6 - In exercise 1, the following estimated regression...Ch. 15.6 - Prob. 28ECh. 15.6 - Prob. 29ECh. 15.6 - Prob. 31ECh. 15.7 - Consider a regression study involving a dependent...Ch. 15.7 - Consider a regression study involving a dependent...Ch. 15.7 - 34. Management proposed the following regression...Ch. 15.7 - Repair Time. Refer to the Johnson Filtration...Ch. 15.7 - Extending Model for Repair Time. This problem is...Ch. 15.7 - 37. The Consumer Reports Restaurant Customer...Ch. 15.9 - In Table 15.12 we provided estimates of the...Ch. 15 - 49. The admissions officer for Clearwater College...Ch. 15 - 50. The personnel director for Electronics...Ch. 15 - Prob. 51SECh. 15 - Prob. 52SECh. 15 - Recall that in exercise 50 the personnel director...Ch. 15 - Analyzing Repeat Purchases. The Tire Rack,...Ch. 15 - Prob. 55SECh. 15 - Mutual Fund Returns. A portion of a data set...Ch. 15 - Prob. 57SECh. 15 - Consumer Research, Inc., is an independent agency...Ch. 15 - Matt Kenseth won the 2012 Daytona 500, the most...Ch. 15 - When trying to decide what car to buy, real value...
Knowledge Booster


Learn more about
Need a deep-dive on the concept behind this application? Look no further. Learn more about this topic, statistics and related others by exploring similar questions and additional content below.Similar questions
- Olympic Pole Vault The graph in Figure 7 indicates that in recent years the winning Olympic men’s pole vault height has fallen below the value predicted by the regression line in Example 2. This might have occurred because when the pole vault was a new event there was much room for improvement in vaulters’ performances, whereas now even the best training can produce only incremental advances. Let’s see whether concentrating on more recent results gives a better predictor of future records. (a) Use the data in Table 2 (page 176) to complete the table of winning pole vault heights shown in the margin. (Note that we are using x=0 to correspond to the year 1972, where this restricted data set begins.) (b) Find the regression line for the data in part ‚(a). (c) Plot the data and the regression line on the same axes. Does the regression line seem to provide a good model for the data? (d) What does the regression line predict as the winning pole vault height for the 2012 Olympics? Compare this predicted value to the actual 2012 winning height of 5.97 m, as described on page 177. Has this new regression line provided a better prediction than the line in Example 2?arrow_forwardThe following fictitious table shows kryptonite price, in dollar per gram, t years after 2006. t= Years since 2006 0 1 2 3 4 5 6 7 8 9 10 K= Price 56 51 50 55 58 52 45 43 44 48 51 Make a quartic model of these data. Round the regression parameters to two decimal places.arrow_forwardWhat does the y -intercept on the graph of a logistic equation correspond to for a population modeled by that equation?arrow_forward
- For the following exercises, consider this scenario: The profit of a company decreased steadily overa ten-year spam.The following ordered pairs shows dollars and the number of units sold in hundreds and the profit in thousands ofover the ten-year span, (number of units sold, profit) for specific recorded years: (46,600),(48,550),(50,505),(52,540),(54,495). Use linear regression to determine a function Pwhere the profit in thousands of dollars depends onthe number of units sold in hundreds.arrow_forwardTable 6 shows the population, in thousands, of harbor seals in the Wadden Sea over the years 1997 to 2012. a. Let x represent time in years starting with x=0 for the year 1997. Let y represent the number of seals in thousands. Use logistic regression to fit a model to these data. b. Use the model to predict the seal population for the year 2020. c. To the nearest whole number, what is the limiting value of this model?arrow_forwardTable 2 shows a recent graduate’s credit card balance each month after graduation. a. Use exponential regression to fit a model to these data. b. If spending continues at this rate, what will the graduate’s credit card debt be one year after graduating?arrow_forward
- A researcher investigates the relationship between cigarette smoking (X) and work absences (Y). The number of cigarettes smoked daily and the number of days absent from work due to illness are collected for N= 12 employees. The preliminary results are below: What is the regression equation? How many absences (Y) would expect someone who smokes X = 10 cigarettes a day to have?arrow_forwardA soft drink bottling company wants to develop a regression model to predict delivery time (in minutes) based on the number of cases delivered. A sample of 16 deliveries was selected. The Excel output for this regression model is given below. (a) State the regression equation. (b) Interpret the meaning of b0 and b1 in this problem. (c) What is the predicted delivery time when the number of cases is 30 , assuming 30 is within the range of number of cases delivered for this problem? (d) At the 0.05 level of significance, is there evidence of a linear relationship between the number of cases delivered and the delivery time? (e) Construct a 95% confidence interval estimate of the population slope β1. Interpret the confidence interval estimate. (f) How useful do you think this regression model is for predicting the delivery times?arrow_forward
arrow_back_ios
arrow_forward_ios
Recommended textbooks for you
 College AlgebraAlgebraISBN:9781305115545Author:James Stewart, Lothar Redlin, Saleem WatsonPublisher:Cengage Learning
 Functions and Change: A Modeling Approach to Coll...AlgebraISBN:9781337111348Author:Bruce Crauder, Benny Evans, Alan NoellPublisher:Cengage Learning
 Algebra & Trigonometry with Analytic GeometryAlgebraISBN:9781133382119Author:SwokowskiPublisher:Cengage
 Algebra and Trigonometry (MindTap Course List)AlgebraISBN:9781305071742Author:James Stewart, Lothar Redlin, Saleem WatsonPublisher:Cengage Learning
 Glencoe Algebra 1, Student Edition, 9780079039897...AlgebraISBN:9780079039897Author:CarterPublisher:McGraw Hill
College Algebra
Algebra
ISBN:9781305115545
Author:James Stewart, Lothar Redlin, Saleem Watson
Publisher:Cengage Learning
Functions and Change: A Modeling Approach to Coll...
Algebra
ISBN:9781337111348
Author:Bruce Crauder, Benny Evans, Alan Noell
Publisher:Cengage Learning
Algebra & Trigonometry with Analytic Geometry
Algebra
ISBN:9781133382119
Author:Swokowski
Publisher:Cengage
Algebra and Trigonometry (MindTap Course List)
Algebra
ISBN:9781305071742
Author:James Stewart, Lothar Redlin, Saleem Watson
Publisher:Cengage Learning
Glencoe Algebra 1, Student Edition, 9780079039897...
Algebra
ISBN:9780079039897
Author:Carter
Publisher:McGraw Hill
Correlation Vs Regression: Difference Between them with definition & Comparison Chart; Author: Key Differences;https://www.youtube.com/watch?v=Ou2QGSJVd0U;License: Standard YouTube License, CC-BY
Correlation and Regression: Concepts with Illustrative examples; Author: LEARN & APPLY : Lean and Six Sigma;https://www.youtube.com/watch?v=xTpHD5WLuoA;License: Standard YouTube License, CC-BY