
MindTap Business Statistics, 1 term (6 months) Printed Access Card for Anderson/Sweeney/Williams/Camm/Cochran's Essentials of Statistics for Business and Economics, 8th
8th Edition
ISBN: 9781337114288
Author: Anderson, David R.; Sweeney, Dennis J.; Williams, Thomas A.; Camm, Jeffrey D.; Cochran, James J.
Publisher: Cengage Learning
expand_more
expand_more
format_list_bulleted
Concept explainers
Videos
Textbook Question
Chapter 15.2, Problem 7E
Rating Computer Monitors. PC Magazine provided ratings for several characteristics of computer monitors, including an overall rating (PC Magazine website). The following data show the rating for contrast ratio, resolution, and the overall rating for ten monitors tested using a 0–100 point scale. The highest rated monitor was the BenQ BL3201PH, with an overall rating of 87.
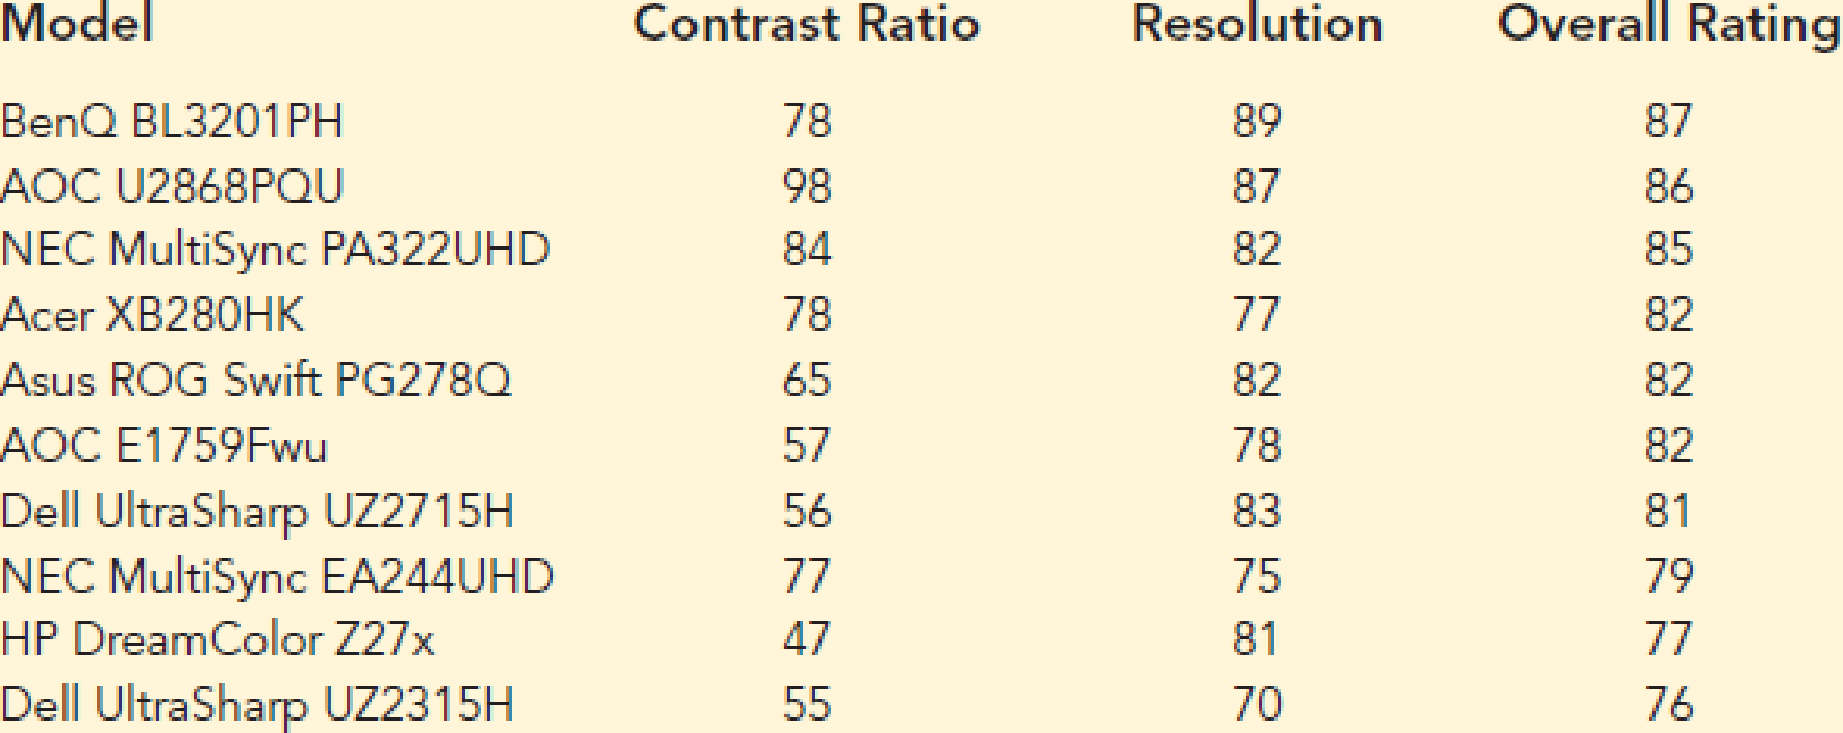
- a. Develop the estimated regression equation that can be used to predict the Overall Rating using the Contrast Ratio Rating.
- b. Develop the estimated regression equation that can be used to predict the Overall Rating using both the Contrast Ratio Rating and the Resolution Rating.
- c. Predict the Overall Rating for a computer monitor computer that has a Contrast Ratio Rating of 85 and a Resolution Rating of 74.
Expert Solution & Answer

Trending nowThis is a popular solution!

Students have asked these similar questions
The regional transit authority for a major metropolitan area wants to determine whetherthere is a relationship between the age of a bus and the annual maintenance cost. A sampleof ten buses resulted in the following data:
a. Develop a scatter chart for these data. What does the scatter chart indicate about therelationship between age of a bus and the annual maintenance cost?b. Use the data to develop an estimated regression equation that could be used to predictthe annual maintenance cost given the age of the bus. What is the estimated regressionmodel?c. Test whether each of the regression parameters b0 and b1 is equal to zero at a 0.05level of significance. What are the correct interpretations of the estimated regressionparameters? Are these interpretations reasonable?d. How much of the variation in the sample values of annual maintenance cost does themodel you estimated in part b explain?e. What do you predict the annual maintenance cost to be for a 3.5-year-old bus?
In the table below ratings data on x= the quality of the speed of execution and y= overall satisfaction with electronic trades provided the estimated regression equation y^= -0.9082 + 1.2404x (AAII website).
Brokerage
Speed
Satisfaction
Scottrade, Inc.
3.1
2.8
Charles Schwab
3.6
3.4
Fidelity Brokerage Services
2.9
2.6
TD Ameritrade
3.1
3.0
E*Trade Financial
3.6
3.9
Vanguard Brokerage Services
3.5
3.8
USAA Brokerage Services
3.3
3.7
Thinkorswim
3.8
3.8
Wells Fargo Investments
3.5
3.2
Interactive Brokers
3.1
2.6
Zecco.com
3.9
3.6
-select your answer choices-
P-value is
less than 0.01
between 0.01 and 0.02
between 0.02 and 0.05
between 0.05 and 0.10
between 0.10 and 0.20
between 0.20 and 0.40
greater than 0.40
Conclusion
We (can not, can) reject H0: B1=0, we conclude that speed of execution and overall satisfaction (are, are not) related.
Thank you!
The regional transit authority for a major metropolitan area wants to determine whether there is any relationship between the age of a bus and the annual maintenance cost. A sample of 10 buses resulted in the data in Worksheet 2.
Worksheet 2
Age of a Bus (years)
Maintenance Cost ($)
1
350
2
370
2
480
2
520
2
590
3
550
4
750
4
800
5
790
5
950
Develop a scatter diagram with the age of a bus as the independent variable.
Develop the estimated regression equation that can be used to predict the maintenance cost given the age of a bus.
Determine the coefficient of determination, and interpret its meaning in this problem.
At the 0.05 level of significance, is there evidence of a linear relationship between the age of a bus and the annual maintenance cost.
Chapter 15 Solutions
MindTap Business Statistics, 1 term (6 months) Printed Access Card for Anderson/Sweeney/Williams/Camm/Cochran's Essentials of Statistics for Business and Economics, 8th
Ch. 15.2 - The estimated regression equation for a model...Ch. 15.2 - Prob. 2ECh. 15.2 - 3. In a regression analysis involving 30...Ch. 15.2 - A shoe store developed the following estimated...Ch. 15.2 - Prob. 5ECh. 15.2 - NFL Winning Percentage. The National Football...Ch. 15.2 - Rating Computer Monitors. PC Magazine provided...Ch. 15.2 - Scoring Cruise Ships. The Condé Nast Traveler Gold...Ch. 15.2 - Prob. 9ECh. 15.2 - Baseball Pitcher Performance. Major League...
Ch. 15.3 - In exercise 1, the following estimated regression...Ch. 15.3 - Prob. 12ECh. 15.3 - 13. In exercise 3, the following estimated...Ch. 15.3 - In exercise 4, the following estimated regression...Ch. 15.3 - Prob. 15ECh. 15.3 - 16. In exercise 6, data were given on the average...Ch. 15.3 - Prob. 17ECh. 15.3 - R2 in Predicting Baseball Pitcher Performance....Ch. 15.5 - In exercise 1, the following estimated regression...Ch. 15.5 - Prob. 20ECh. 15.5 - The following estimated regression equation was...Ch. 15.5 - Testing Significance in Shoe Sales Prediction. In...Ch. 15.5 - Testing Significance in Theater Revenue. Refer to...Ch. 15.5 - Testing Significance in Predicting NFL Wins. The...Ch. 15.5 - Prob. 25ECh. 15.5 - Testing Significance in Baseball Pitcher...Ch. 15.6 - In exercise 1, the following estimated regression...Ch. 15.6 - Prob. 28ECh. 15.6 - Prob. 29ECh. 15.6 - Prob. 31ECh. 15.7 - Consider a regression study involving a dependent...Ch. 15.7 - Consider a regression study involving a dependent...Ch. 15.7 - 34. Management proposed the following regression...Ch. 15.7 - Repair Time. Refer to the Johnson Filtration...Ch. 15.7 - Extending Model for Repair Time. This problem is...Ch. 15.7 - 37. The Consumer Reports Restaurant Customer...Ch. 15.9 - In Table 15.12 we provided estimates of the...Ch. 15 - 49. The admissions officer for Clearwater College...Ch. 15 - 50. The personnel director for Electronics...Ch. 15 - Prob. 51SECh. 15 - Prob. 52SECh. 15 - Recall that in exercise 50 the personnel director...Ch. 15 - Analyzing Repeat Purchases. The Tire Rack,...Ch. 15 - Prob. 55SECh. 15 - Mutual Fund Returns. A portion of a data set...Ch. 15 - Prob. 57SECh. 15 - Consumer Research, Inc., is an independent agency...Ch. 15 - Matt Kenseth won the 2012 Daytona 500, the most...Ch. 15 - When trying to decide what car to buy, real value...
Knowledge Booster


Learn more about
Need a deep-dive on the concept behind this application? Look no further. Learn more about this topic, statistics and related others by exploring similar questions and additional content below.Similar questions
- Find the equation of the regression line for the following data set. x 1 2 3 y 0 3 4arrow_forwardFor the following exercises, use Table 4 which shows the percent of unemployed persons 25 years or older who are college graduates in a particular city, by year. Based on the set of data given in Table 5, calculate the regression line using a calculator or other technology tool, and determine the correlation coefficient. Round to three decimal places of accuracyarrow_forwardFor the following exercises, consider the data in Table 5, which shows the percent of unemployed in a city ofpeople25 years or older who are college graduates is given below, by year. 41. Based on the set of data given in Table 7, calculatethe regression line using a calculator or othertechnology tool, and determine the correlationcoefficient to three decimal places.arrow_forward
- For the following exercises, consider the data in Table 5, which shows the percent of unemployed ina city of people 25 years or older who are college graduates is given below, by year. 40. Based on the set of data given in Table 6, calculate the regression line using a calculator or other technology tool, and determine the correlation coefficient to three decimal places.arrow_forwardLife Expectancy The following table shows the average life expectancy, in years, of a child born in the given year42 Life expectancy 2005 77.6 2007 78.1 2009 78.5 2011 78.7 2013 78.8 a. Find the equation of the regression line, and explain the meaning of its slope. b. Plot the data points and the regression line. c. Explain in practical terms the meaning of the slope of the regression line. d. Based on the trend of the regression line, what do you predict as the life expectancy of a child born in 2019? e. Based on the trend of the regression line, what do you predict as the life expectancy of a child born in 1580?2300arrow_forward
arrow_back_ios
arrow_forward_ios
Recommended textbooks for you
 Functions and Change: A Modeling Approach to Coll...AlgebraISBN:9781337111348Author:Bruce Crauder, Benny Evans, Alan NoellPublisher:Cengage Learning

 Glencoe Algebra 1, Student Edition, 9780079039897...AlgebraISBN:9780079039897Author:CarterPublisher:McGraw Hill
 Big Ideas Math A Bridge To Success Algebra 1: Stu...AlgebraISBN:9781680331141Author:HOUGHTON MIFFLIN HARCOURTPublisher:Houghton Mifflin Harcourt
Functions and Change: A Modeling Approach to Coll...
Algebra
ISBN:9781337111348
Author:Bruce Crauder, Benny Evans, Alan Noell
Publisher:Cengage Learning
Glencoe Algebra 1, Student Edition, 9780079039897...
Algebra
ISBN:9780079039897
Author:Carter
Publisher:McGraw Hill
Big Ideas Math A Bridge To Success Algebra 1: Stu...
Algebra
ISBN:9781680331141
Author:HOUGHTON MIFFLIN HARCOURT
Publisher:Houghton Mifflin Harcourt
Correlation Vs Regression: Difference Between them with definition & Comparison Chart; Author: Key Differences;https://www.youtube.com/watch?v=Ou2QGSJVd0U;License: Standard YouTube License, CC-BY
Correlation and Regression: Concepts with Illustrative examples; Author: LEARN & APPLY : Lean and Six Sigma;https://www.youtube.com/watch?v=xTpHD5WLuoA;License: Standard YouTube License, CC-BY