
Concept explainers
Videos
Testing Significance in Baseball Pitcher Performance. In exercise 10, data showing the values of several pitching statistics for a random sample of 20 pitchers from the American League of Major League Baseball were provided. In part (c) of this exercise an estimated regression equation was developed to predict the average number of runs given up per inning pitched (R/IP) given the average number of strikeouts per inning pitched (SO/IP) and the average number of home runs per inning pitched (HR/IP).
- a. Use the F test to determine the overall significance of the relationship. What is your conclusion at the .05 level of significance?
- b. Use the t test to determine the significance of each independent variable. What is your conclusion at the .05 level of significance?
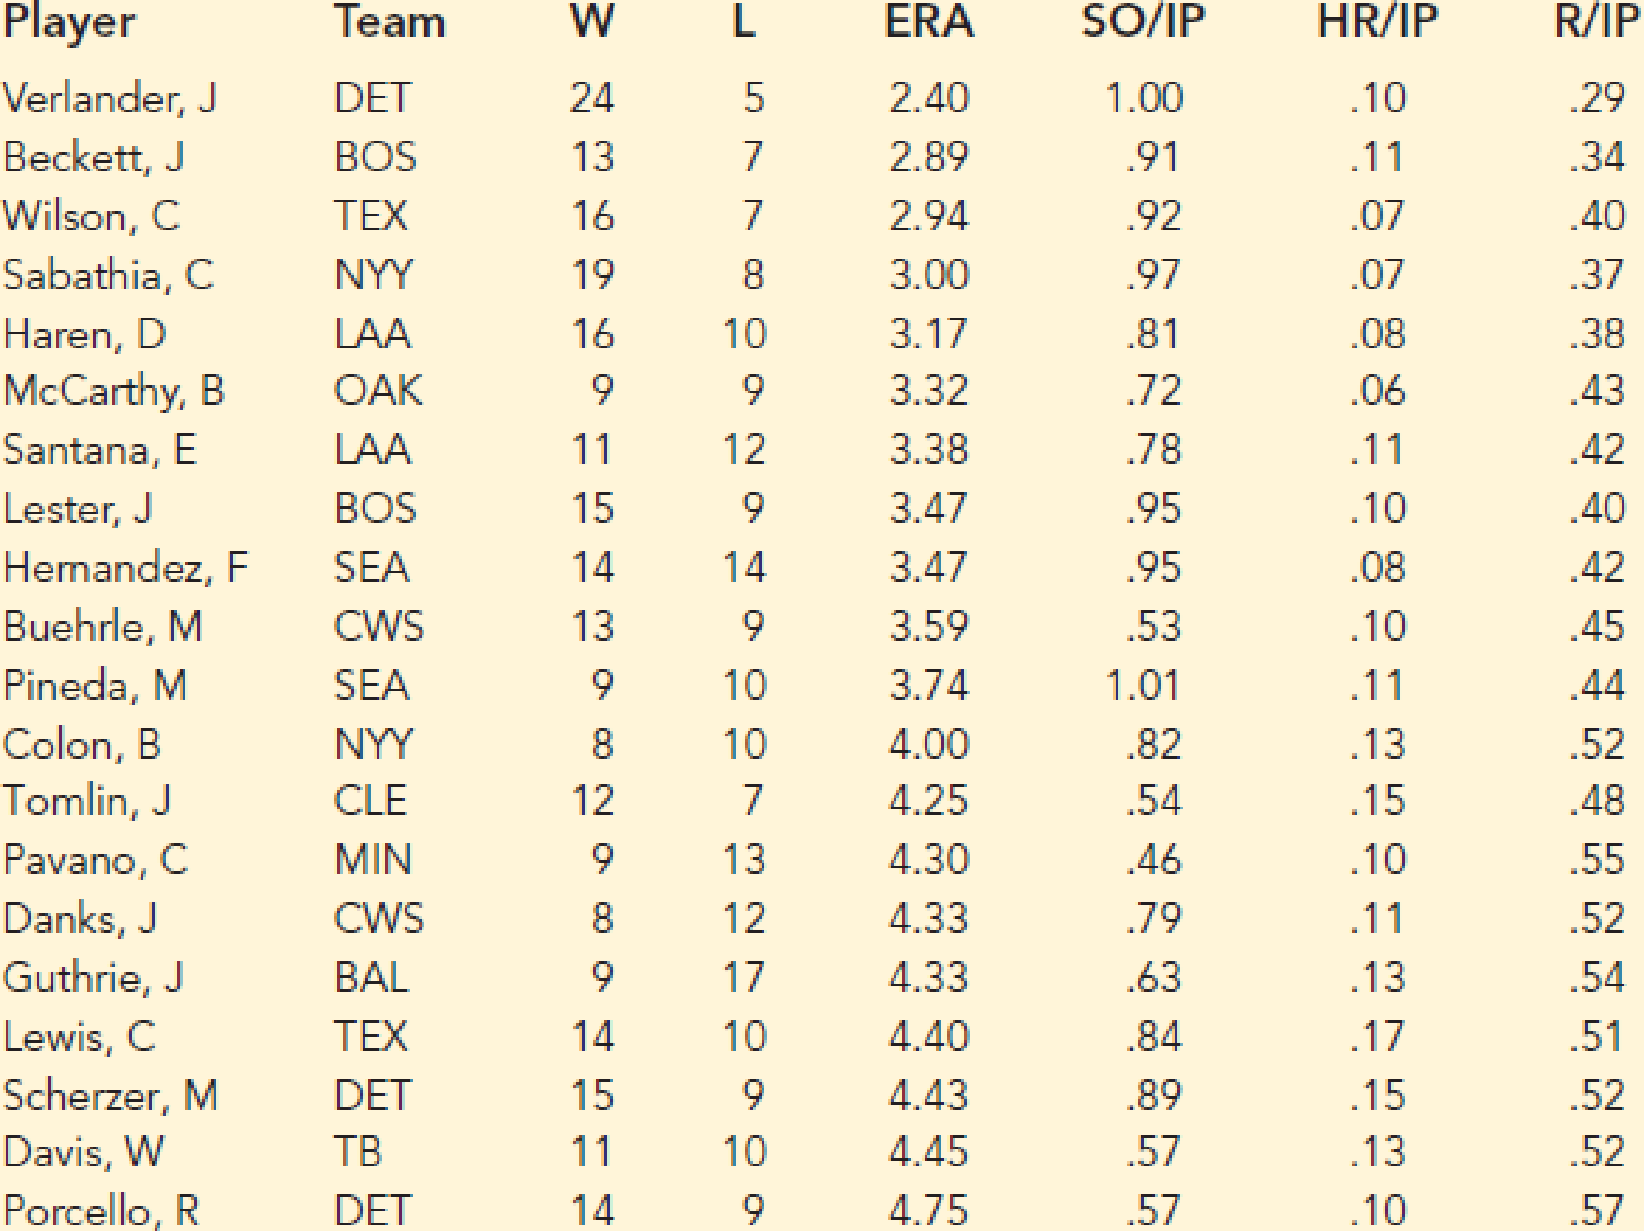
10. Baseball Pitcher Performance. Major League Baseball (MLB) consists of teams that play in the American League and the National League. MLB collects a wide variety of team and player statistics. Some of the statistics often used to evaluate pitching performance are as follows:
ERA: The average number of earned runs given up by the pitcher per nine innings. An earned run is any run that the opponent scores off a particular pitcher except for runs scored as a result of errors.
SO/IP: The average number of strikeouts per inning pitched.
HR/IP: The average number of home runs per inning pitched.
R/IP: The number of runs given up per inning pitched.
The following data show values for these statistics for a random sample of 20 pitchers from the American League for a full season.
- a. Develop an estimated regression equation that can be used to predict the average number of runs given up per inning given the average number of strikeouts per inning pitched.
- b. Develop an estimated regression equation that can be used to predict the average number of runs given up per inning given the average number of home runs per inning pitched.
- c. Develop an estimated regression equation that can be used to predict the average number of runs given up per inning given the average number of strikeouts per inning pitched and the average number of home runs per inning pitched.
- d. A. J. Burnett, a pitcher for the New York Yankees, had an average number of strikeouts per inning pitched of .91 and an average number of home runs per inning of .16. Use the estimated regression equation developed in part (c) to predict the average number of runs given up per inning for A. J. Burnett. (Note: The actual value for R/IP was .6.)
- e. Suppose a suggestion was made to also use the earned run average as another independent variable in part (c). What do you think of this suggestion?

Trending nowThis is a popular solution!

Chapter 15 Solutions
MindTap Business Statistics, 1 term (6 months) Printed Access Card for Anderson/Sweeney/Williams/Camm/Cochran's Essentials of Statistics for Business and Economics, 8th


- Life Expectancy The following table shows the average life expectancy, in years, of a child born in the given year42 Life expectancy 2005 77.6 2007 78.1 2009 78.5 2011 78.7 2013 78.8 a. Find the equation of the regression line, and explain the meaning of its slope. b. Plot the data points and the regression line. c. Explain in practical terms the meaning of the slope of the regression line. d. Based on the trend of the regression line, what do you predict as the life expectancy of a child born in 2019? e. Based on the trend of the regression line, what do you predict as the life expectancy of a child born in 1580?2300arrow_forwardNFL Winning Percentage. The National Football League (NFL) records avariety of performance data for individuals and teams. To investigate theimportance of passing on the percentage of games won by a team, the following data show the conference (Conf), average number of passingyards per attempt (Yds/Att), the number of interceptions thrown perattempt (Int/Att), and the percentage of games won (Win%) for a randomsample of 16 NFL teams for one full season. a. Develop the estimated regression equation that could be used topredict the percentage of games won given the average number ofpassing yards per attempt.b. Develop the estimated regression equation that could be used to predict the percentage of games won given the number ofinterceptions thrown per attempt.c. Develop the estimated regression equation that could be used topredict the percentage of games won given the average number ofpassing yards per attempt and the number of interceptions thrown per attempt.d. The average number of…arrow_forwardAppendix B Data Sets. In Exercises 13–16, refer to the indicated data set in Appendix B and use technology to obtain results. Predicting IQ Score Refer to Data Set 8 “IQ and Brain Size” in Appendix B and find the best regression equation with IQ score as the response (y) variable. Use predictor variables of brain volume and/or body weight. Why is this equation best? Based on these results, can we predict someone’s IQ score if we know their brain volume and body weight? Based on these results, does it appear that people with larger brains have higher IQ scores?arrow_forward
- Improving SAT scores. Chance (Winter 2001) published a study of students who paid a private coach to help them improve their Scholastic Assessment Test (SAT) scores. Multiple regression was used to estimate the effect of coaching on SAT–Mathematics scores. Data on 3,492 students (573 of whom were coached) were used to fit the model E(y) = β0 + β1x1 + β2x2,where y = SAT–Math score,x1 = score on PSAT, and x2 ={1 if student was coached, 0 if not}. (A). The fitted model had an adjusted R2 value of .76. Interpret this result. (B). The estimate of β2 in the model was 19, with a standard error of 3. Use this information to form a 95% confidence interval for β2. Interpret the interval. (C). Based on the interval, part b, what can you say about the effect of coaching on SAT–Math scores? (D). As an alternative model, the researcher added several ‘‘control’’ variables, including dummy variables for student ethnicity (x3,x4, and x5), a socioeconomic status index variable (x6), two variables that…arrow_forwardCity Fuel Consumption: Finding the Best Multiple Regression Equation. In Exercises 9–12, refer to the accompanying table, which was obtained using the data from 21 cars listed in Data Set 20 “Car Measurements” in Appendix B. The response (y) variable is CITY (fuel consumption in mi/gal). The predictor (x) variables are WT (weight in pounds), DISP (engine displacement in liters), and HWY (highway fuel consumption in mi /gal). If exactly two predictor (x) variables are to be used to predict the city fuel consumption, which two variables should be chosen? Why?arrow_forwardTraining Dept. of Nimrod Inc wants to develop a regression-based compensation model (compensation in $ per year, Comp) for its mid-level managers to encourage performance, loyalty, and continuing education based on three variables. ▪ Business unit-profitability (Profit per year in $). ▪ Working experiences in Nimrod Inc (Years). ▪ Whether or not a manager has a graduate degree (Grads). If a manager has a graduate degree equals 1, 0 otherwise. Table Attached Question: At the 5% significance level, is the overall regression model significantarrow_forward
- a. Compute the Pearson correlation statistic b. Find the linear regression equation for predicting Y from X. c. Explain the difference between b in a linear regression equation and the Pearson correlation statistic.arrow_forwardCity Fuel Consumption: Finding the Best Multiple Regression Equation. In Exercises 9–12, refer to the accompanying table, which was obtained using the data from 21 cars listed in Data Set 20 “Car Measurements” in Appendix B. The response (y) variable is CITY (fuel consumption in mi/gal). The predictor (x) variables are WT (weight in pounds), DISP (engine displacement in liters), and HWY (highway fuel consumption in mi /gal). A Honda Civic weighs 2740 lb, it has an engine displacement of 1.8 L, and its highway fuel consumption is 36 mi/gal. What is the best predicted value of the city fuel consumption? Is that predicted value likely to be a good estimate? Is that predicted value likely to be very accurate?arrow_forward
 Elementary Linear Algebra (MindTap Course List)AlgebraISBN:9781305658004Author:Ron LarsonPublisher:Cengage Learning
 Functions and Change: A Modeling Approach to Coll...AlgebraISBN:9781337111348Author:Bruce Crauder, Benny Evans, Alan NoellPublisher:Cengage Learning