
Concept explainers
Videos
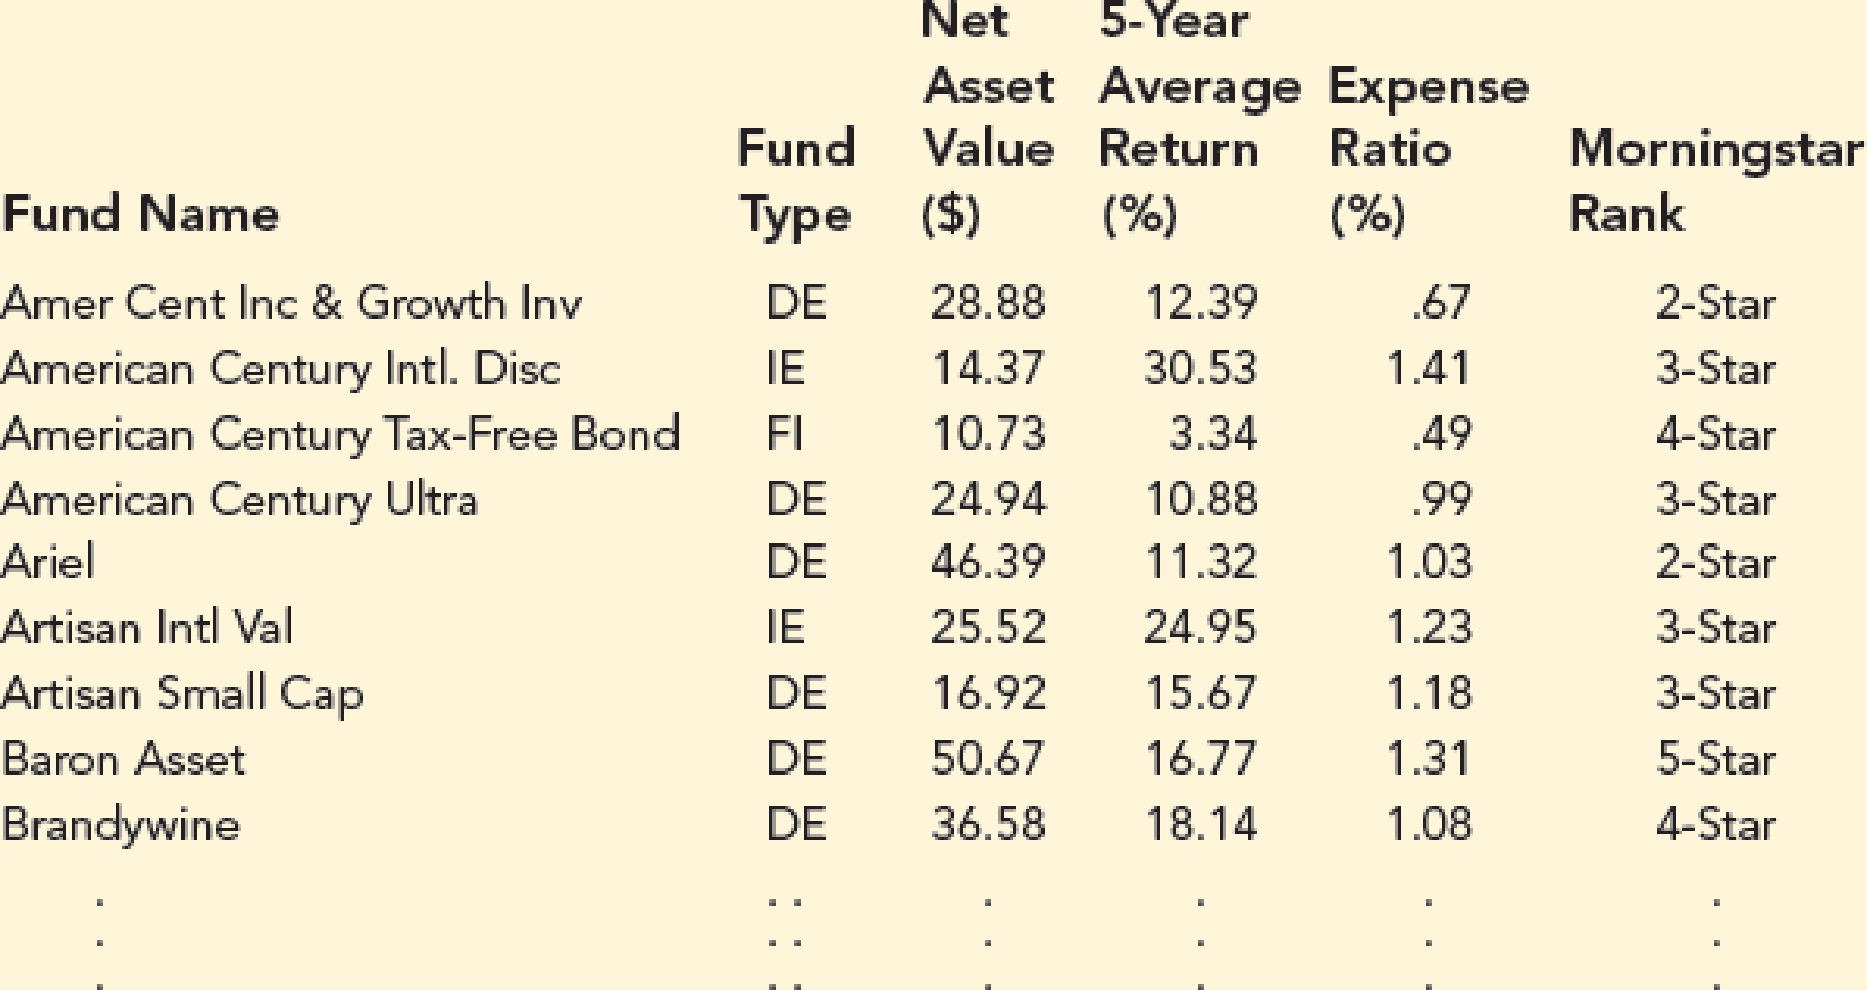
Mutual Fund Returns. A portion of a data set containing information for 45 mutual funds that are part of the Morningstar Funds 500 follows. The complete data set is available in the file named MutualFunds. The data set includes the following five variables:
Fund Type: The type of fund, labeled DE (Domestic Equity), IE (International Equity), and FI (Fixed Income)
Net Asset Value ($): The closing price per share on December 31, 2007
5-Year Average Return (%): The average annual return for the fund over the past five years
Expense Ratio (%): The percentage of assets deducted each fiscal year for fund expenses
Morningstar Rank: The risk adjusted star rating for each fund; Morningstar ranks go from a low of 1-Star to a high of 5-Stars
- a. Develop an estimated regression equation that can be used to predict the 5-year average return given the type of fund. At the .05 level of significance, test for a significant relationship.
- b. Did the estimated regression equation developed in part (a) provide a good fit to the data? Explain.
- c. Develop the estimated regression equation that can be used to predict the 5-year average return given the type of fund, the net asset value, and the expense ratio. At the .05 level of significance, test for a significant relationship. Do you think any variables should be deleted from the estimated regression equation? Explain.
- d. Morningstar Rank is a categorical variable. Because the data set contains only funds with four ranks (2-Star through 5-Star), use the following dummy variables: 3StarRank = 1 for a 3-Star fund, 0 otherwise; 4StarRank = 1 for a 4-Star fund, 0 otherwise; and 5StarRank = 1 for a 5-Star fund, 0 otherwise. Develop an estimated regression equation that can be used to predict the 5-year average return given the type of fund, the expense ratio, and the Morningstar Rank. Using α = .05, remove any independent variables that are not significant.
- e. Use the estimated regression equation developed in part (d) to predict the 5-year average return for a domestic equity fund with an expense ratio of 1.05% and a 3-Star Morningstar Rank.
a.
Find an estimated regression equation that could be used to predict the 5-year average return given the type of fund.
Perform a test to check the significant relationship between variables at
Answer to Problem 56SE
The estimated regression equation that could be used to predict the 5-year average return given the type of fund is
There is a significant relationship between dependent variable (y) and independent variables FundDE (
Explanation of Solution
Calculation:
The data related to the type of fund, net asset value, 5 year average return, expense ratio and management risk of 45 mutual funds, are given.
Multiple linear regression model:
A multiple linear regression model is given as
The dummy variable FundDE is defined as is,
The dummy variable FundIE is defined as is,
In the given problem, five year average return be the dependent variable (y), FundDE be the independent variable (
Regression:
Software procedure:
Step-by-step procedure to get regression equation using EXCEL software:
- Open an EXCEL sheet and enter the data of FundDE, FundIE, and 5 Year Average Return corresponding to columns A, B, and D, respectively.
- Select Data > Data Analysis > Regression.
- Click OK.
- Under Input Y Range enter $D$1:$D$46.
- Under Input X Range enter $A$1:$B$46.
- Click the box of Labels.
- Under Output Range enter $I$1.
- Click OK.
The output using EXCEL software is given as,
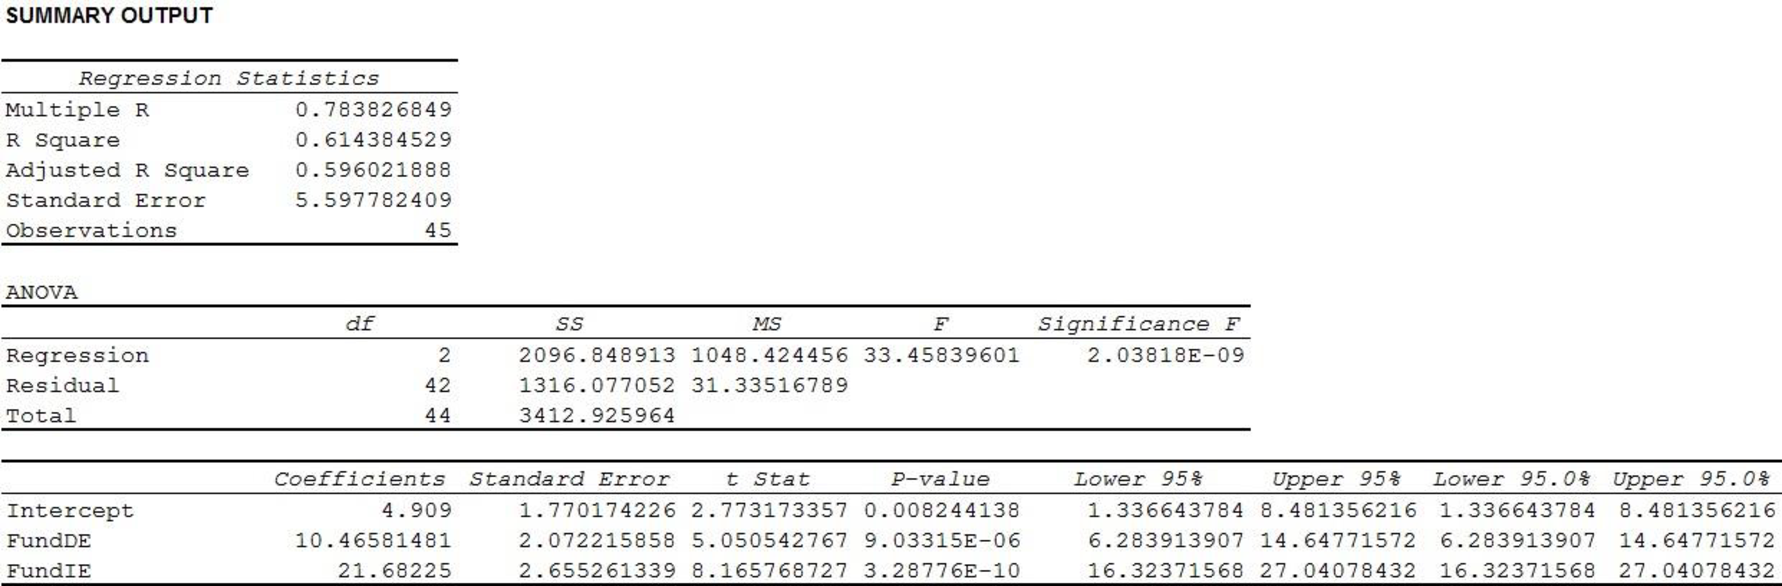
Thus, the estimated regression equation that could be used to predict the 5-year average return given the type of fund is
State the test hypotheses.
Null hypothesis:
That is, there is not a significant relationship between dependent variable (y) and independent variables FundDE (
Alternative hypothesis:
That is, there is a significant relationship between dependent variable (y) and independent variables FundDE (
According the output, it is found that the F statistic with numerator df of 2 and denominator df of 42, corresponding to regression is 33.4584 and the p value for F statistic corresponding to regression is 0.000.
Level of significance:
The given level of significance is
Rejection rule:
- If the
- Otherwise, failed to reject the null hypothesis.
Conclusion:
Here, the p-value is less than the level of significance.
That is,
Thus, the decision is “reject the null hypothesis”.
Therefore, the data provide sufficient evidence to conclude that there is a significant relationship between dependent variable (y) and independent variables FundDE (
b.
Whether the estimated regression equation in part (a) provides a good fit.
Explanation of Solution
The coefficient of determination (
In the given output,
Thus, the 64.44% of variation in the observed values of dependent variable is explained by the regression, which indicates that 61.44% of the variability in dependent variable is explained by the variability in independent variables using the linear regression model.
Thus, the model provides a good fit.
c.
Find an estimated regression equation that could be used to predict the 5-year average return given the type of fund, the net asset value and the expense ratio.
Perform a test to check the significant relationship between variables at
Explain whether any variable should be deleted from the estimated regression equation.
Answer to Problem 56SE
The estimated regression equation that could be used to predict the 5-year average return given the type of fund, the net asset value and the expense ratio is
There is a significant relationship between dependent variable (y) and independent variables FundDE (
The Net Asset value should be deleted from the estimated regression equation.
Explanation of Solution
Calculation:
Here, five year average return be the dependent variable (y), FundDE (
Regression:
Software procedure:
Step-by-step procedure to get regression equation using EXCEL software:
- Open an EXCEL sheet and enter the data of FundDE, FundIE, Net Asset Value, Expense Ratio, and 5 Year Average Return corresponding to columns A, B, C, D, and E, respectively.
- Select Data > Data Analysis > Regression.
- Click OK.
- Under Input Y Range enter $D$1:$D$46.
- Under Input X Range enter $A$1:$B$46.
- Click the box of Labels.
- Under Output Range enter $I$1.
- Click OK.
The output using EXCEL software is given as,
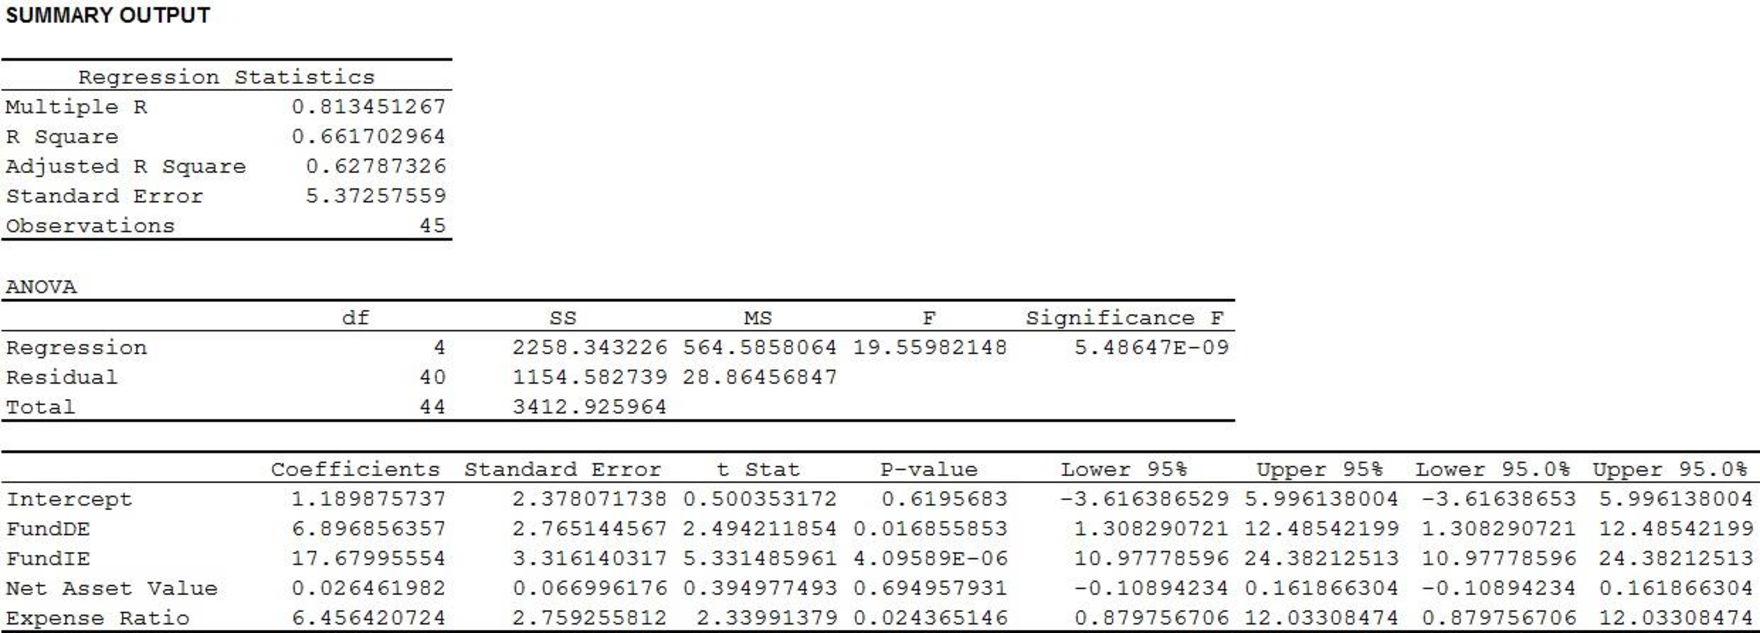
Thus,the estimated regression equation that could be used to predict the 5-year average return given the type of fund, the net asset value and the expense ratio is
State the test hypotheses.
Null hypothesis:
That is, there is not a significant relationship between dependent variable (y) and independent variables FundDE (
Alternative hypothesis:
That is, there is a significant relationship between dependent variable (y) and independent variables FundDE (
According the output, it is found that the F statistic with numerator df of 4 and denominator df of 40, corresponding to regression is 19.5598 and the p value for F statistic corresponding to regression is 0.000.
Conclusion:
Here, the p-value is less than the level of significance.
That is,
Thus, the decision is “reject the null hypothesis”.
Therefore, the data provide sufficient evidence to conclude that there is a significant relationship between dependent variable (y) and independent variables FundDE (
State the test hypotheses.
Null hypothesis:
That is, the addition of the independent variable FundDE is not significant.
Alternative hypothesis:
That is, the addition of the independent variable FundDE is significant.
From the output, it is found that the t statistic corresponding to FundDE is 2.7651 with df of 40 and the p value is 0.017.
Conclusion:
Here, the p-value is less than the level of significance.
That is,
Thus, the decision is “reject the null hypothesis”.
Therefore, the data provide sufficient evidence to conclude that the addition of the independent variable FundDE is significant.
State the test hypotheses.
Null hypothesis:
That is, the addition of the FundIE is not significant.
Alternative hypothesis:
That is, the addition of the FundIE is significant.
From the output, it is found that the t statistic corresponding to FundIE is 5.3315 with df of 40 and the p value is 0.000.
Conclusion:
Here, the p-value is less than the level of significance.
That is,
Thus, the decision is “reject the null hypothesis”.
Therefore, the data provide sufficient evidence to conclude that the addition of the dummy variableFundIE is significant.
State the test hypotheses.
Null hypothesis:
That is, the addition of the Net Asset Value is not significant.
Alternative hypothesis:
That is, the addition of the Net Asset Value is significant.
From the output, it is found that the t statistic corresponding to Net Asset Value is 0.6950 with df of 40 and the p value is 0.695.
Conclusion:
Here, the p-value is greater than the level of significance.
That is,
Thus, the decision is “fail to reject the null hypothesis”.
Therefore, the data do not provide sufficient evidence to conclude that the addition of the Net Asset Value is significant.
State the test hypotheses.
Null hypothesis:
That is, the addition of the Expense Ratio is not significant.
Alternative hypothesis:
That is, the addition of the Expense Ratio is significant.
From the output, it is found that the t statistic corresponding to Expense Ratio is 2.3399 with df of 40 and the p value is 0.024.
Conclusion:
Here, the p-value is less than the level of significance.
That is,
Thus, the decision is “reject the null hypothesis”.
Therefore, the data provide sufficient evidence to conclude that the addition of the Expense Ratio is significant.
Thus, Net Asset value is not significant and it should be deleted from the estimated regression equation.
d.
Find an estimated regression equation that could be used to predict the 5-year average return given the type of fund, the expense ratio and the Morningstar Rank.
Perform a test at
Answer to Problem 56SE
The estimated regression equation that could be used to predict the 5-year average return given the type of fund, the expense ratio and the Morningstar Rank is
None of the independent variables are deleted from the regression equation.
Explanation of Solution
Calculation:
The dummy variable 3StarRank is defined as is,
The dummy variable 4StarRank is defined as is,
The dummy variable 5StarRank is defined as is,
Here, five year average return be the dependent variable (y), FundDE (
Regression:
Software procedure:
Step-by-step procedure to get regression equation using EXCEL software:
- Open an EXCEL sheet and enter the data of FundDE, FundIE, Expense Ratio, 3StarRank, 4StarRank, 5StarRank, and 5 Year Average Return corresponding to columns A, B, C, D, E, F, and G, respectively.
- Select Data > Data Analysis > Regression.
- Click OK.
- Under Input Y Range enter $G$1:$G$46.
- Under Input X Range enter $A$1:$F$46.
- Click the box of Labels.
- Under Output Range enter $I$1.
- Click OK.
The output using EXCEL software is given as,
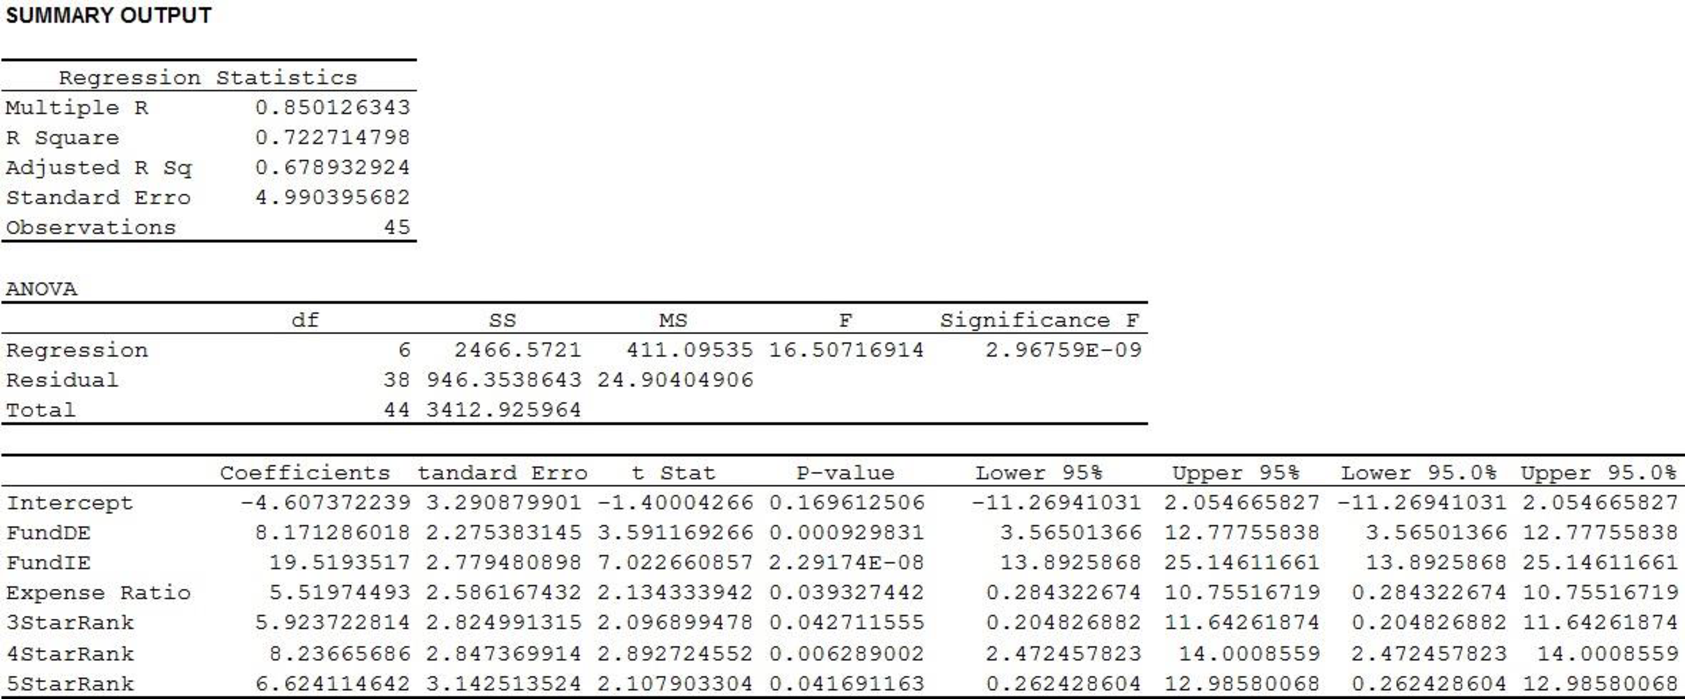
Thus, the estimated regression equation that could be used to predict the 5-year average return given the type of fund, the expense ratio and the Morningstar Rank is
State the test hypotheses.
Null hypothesis:
That is, the addition of the independent variable FundDE is not significant.
Alternative hypothesis:
That is, the addition of the independent variable FundDE is significant.
From the output, it is found that the t statistic corresponding to FundDE is 3.59 with df of 38 and the p value is 0.001.
Conclusion:
Here, the p-value is less than the level of significance.
That is,
Thus, the decision is “reject the null hypothesis”.
Therefore, the data provide sufficient evidence to conclude that the addition of the independentvariable FundDE is significant.
State the test hypotheses.
Null hypothesis:
That is, the addition of the FundIE is not significant.
Alternative hypothesis:
That is, the addition of the FundIE is significant.
From the output, it is found that the t statistic corresponding to FundIE is 7.02 with df of 38 and the p value is 0.000.
Conclusion:
Here, the p-value is less than the level of significance.
That is,
Thus, the decision is “reject the null hypothesis”.
Therefore, the data provide sufficient evidence to conclude that the addition of the dummy variableFundIE is significant.
State the test hypotheses.
Null hypothesis:
That is, the addition of the Expense Ratio is not significant.
Alternative hypothesis:
That is, the addition of the Expense Ratio is significant.
From the output, it is found that the t statistic corresponding to Expense Ratio is 2.13 with df of 38 and the p value is 0.039.
Conclusion:
Here, the p-value is less than the level of significance.
That is,
Thus, the decision is “reject the null hypothesis”.
Therefore, the data provide sufficient evidence to conclude that the addition of the Expense Ratio is significant.
State the test hypotheses.
Null hypothesis:
That is, the addition of the 3StarRank is not significant.
Alternative hypothesis:
That is, the addition of the 3StarRank is significant.
From the output, it is found that the t statistic corresponding to 3StarRank is 2.10 with df of 38 and the p value is 0.043.
Conclusion:
Here, the p-value is less than the level of significance.
That is,
Thus, the decision is “reject the null hypothesis”.
Therefore, the data provide sufficient evidence to conclude that the addition of the 3StarRank is significant.
State the test hypotheses.
Null hypothesis:
That is, the addition of the 4StarRank is not significant.
Alternative hypothesis:
That is, the addition of the 4StarRank is significant.
From the output, it is found that the t statistic corresponding to 4StarRank is 2.89 with df of 38 and the p value is 0.006.
Conclusion:
Here, the p-value is less than the level of significance.
That is,
Thus, the decision is “reject the null hypothesis”.
Therefore, the data provide sufficient evidence to conclude that the addition of the 4StarRank is significant.
State the test hypotheses.
Null hypothesis:
That is, the addition of the 5StarRank is not significant.
Alternative hypothesis:
That is, the addition of the 5StarRank is significant.
From the output, it is found that the t statistic corresponding to 5StarRank is 2.11 with df of 38 and the p value is 0.042.
Conclusion:
Here, the p-value is less than the level of significance.
That is,
Thus, the decision is “reject the null hypothesis”.
Therefore, the data provide sufficient evidence to conclude that the addition of the 5StarRank is significant.
Thus, all the independent variables are significant and no independent variables are deleted from the regression equation.
e.
Predict the 5-year average return for a domestic equality fund with an expense ratio of 1.05% and a 3-star Morningstar Rank.
Answer to Problem 56SE
The predicted the 5-year average return for a domestic equality fund with an expense ratio of 1.05% and a 3-star Morningstar Rank is 15.28%.
Explanation of Solution
Calculation:
According to Part (d) the estimated regression equation that could be used to predict the 5-year average return given the type of fund, the expense ratio and the Morningstar Rank is
The 5-year average return for a domestic equality fund with an expense ratio of 1.05% and a 3-star Morningstar Rank implies that,
Thus, the predicted the 5-year average return for a domestic equality fund with an expense ratio of 1.05% and a 3-star Morningstar Rank is,
Thus, the predicted the 5-year average return for a domestic equality fund with an expense ratio of 1.05% and a 3-star Morningstar Rank is 15.28%.
Want to see more full solutions like this?
Chapter 15 Solutions
MindTap Business Statistics, 1 term (6 months) Printed Access Card for Anderson/Sweeney/Williams/Camm/Cochran's Essentials of Statistics for Business and Economics, 8th


 MATLAB: An Introduction with ApplicationsStatisticsISBN:9781119256830Author:Amos GilatPublisher:John Wiley & Sons Inc
 Probability and Statistics for Engineering and th...StatisticsISBN:9781305251809Author:Jay L. DevorePublisher:Cengage Learning
 Statistics for The Behavioral Sciences (MindTap C...StatisticsISBN:9781305504912Author:Frederick J Gravetter, Larry B. WallnauPublisher:Cengage Learning
 Elementary Statistics: Picturing the World (7th E...StatisticsISBN:9780134683416Author:Ron Larson, Betsy FarberPublisher:PEARSON
 The Basic Practice of StatisticsStatisticsISBN:9781319042578Author:David S. Moore, William I. Notz, Michael A. FlignerPublisher:W. H. Freeman
 Introduction to the Practice of StatisticsStatisticsISBN:9781319013387Author:David S. Moore, George P. McCabe, Bruce A. CraigPublisher:W. H. Freeman