
Introductory Statistics (10th Edition)
10th Edition
ISBN: 9780321989178
Author: Neil A. Weiss
Publisher: PEARSON
expand_more
expand_more
format_list_bulleted
Videos
Textbook Question
Chapter 15.3, Problem 95E
In Exercises 15.92–15.9, presume that the assumptions for regression inferences are met.
15.95 Plaint Emissions. Following are the data on plant weight and quantity of volatile emissions from Exercise 15.25.
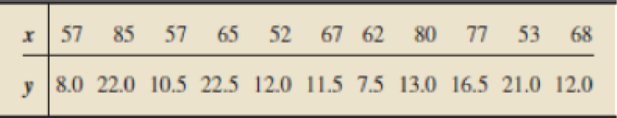
- a. Obtain a point estimate for the mean quantity of volatile emissions of all (Solanum tuberosum) plants that weigh 60 g.
- b. Find a 95% confidence interval for the mean quantity of volatile emissions of all plants that weigh 60 g.
- c. Find the predicted quantity of volatile emissions for a plant that weighs 60 g.
- d. Determine a 95% prediction interval for the quantity of volatile emissions for a plant that weighs 60 g.
Expert Solution & Answer
Want to see the full answer?
Check out a sample textbook solution
Students have asked these similar questions
In exercise 12, the following data on x = average daily hotel room rate and y = amount spent on entertainment (The Wall Street Journal, August 18, 2011) lead to the estimated regression equation ŷ = 17.49 + 1.0334x. For these data SSE = 1541.4.Click on the datafile logo to reference the data. Use Table 1 of Appendix B.
a. Predict the amount spent on entertainment for a particular city that has a daily room rate of $89 (to 2 decimals).$
b. Develop a 95% confidence interval for the mean amount spent on entertainment for all cities that have a daily room rate of $89 (to 2 decimals).$ to $
c. The average room rate in Chicago is $128. Develop a 95% prediction interval for the amount spent on entertainment in Chicago (to 2 decimals).
In Exercises, presume that the assumptions for regression inferences are met.Plant Emissions. Following are the data on plant weight and quantity of volatile emissions from Exercise.
x
57
85
57
65
52
67
62
80
77
53
68
y
8.0
22.0
10.5
22.5
12.0
11.5
7.5
13.0
16.5
21.0
12.0
a. Obtain a point estimate for the mean quantity of volatile emissions of all (Solanum tuberosum) plants that weigh 60 g.b. Find a 95% confidence interval for the mean quantity of volatile emissions of all plants that weigh 60 g.c. Find the predicted quantity of volatile emissions for a plant that weighs 60 g.d. Determine a 95% prediction interval for the quantity of volatile emissions for a plant that weighs 60 g.ExerciseApplying the Concepts and SkillsIn Exercises, we repeat the information from Exercises. For each exercise here, discuss what satisfying Assumptions 1–3 for regression inferences by the variables under consideration would mean.
In Exercises, presume that the assumptions for regression inferences are met.Crown-Rump Length. Following are the data on age of fetuses and length of crown-rump from Exercise.
x
10
10
13
13
18
19
19
23
25
28
y
66
66
108
106
161
166
177
228
235
280
a. Determine a point estimate for the mean crown-rump length of all 19-week-old fetuses.b. Find a 90% confidence interval for the mean crown-rump length of all 19-week-old fetuses.c. Find the predicted crown-rump length of a 19-week-old fetus.d. Determine a 90% prediction interval for the crown-rump length of a 19-week-old fetus.ExerciseApplying the Concepts and SkillsIn Exercises, we repeat the information from Exercises. For each exercise here, discuss what satisfying Assumptions 1–3 for regression inferences by the variables under consideration would mean.
Chapter 15 Solutions
Introductory Statistics (10th Edition)
Ch. 15.1 - Suppose that x and y are predictor and response...Ch. 15.1 - Prob. 2ECh. 15.1 - Prob. 3ECh. 15.1 - Prob. 4ECh. 15.1 - Prob. 5ECh. 15.1 - In Exercises 15.315.6, assume that the variables...Ch. 15.1 - The difference between an observed value and a...Ch. 15.1 - Identify two graphs used in a residual analysis to...Ch. 15.1 - Which graph used in a residual analysis provides...Ch. 15.1 - Figure 15.8 shows three residual plots and a...
Ch. 15.1 - Figure 15.9 on the next page shows three residual...Ch. 15.1 - In Exercises 15.1215.21, we repeat the data and...Ch. 15.1 - In Exercises 15.1215.21, we repeat the data and...Ch. 15.1 - Prob. 14ECh. 15.1 - Prob. 15ECh. 15.1 - Prob. 16ECh. 15.1 - Prob. 17ECh. 15.1 - Prob. 18ECh. 15.1 - Prob. 19ECh. 15.1 - Prob. 20ECh. 15.1 - Prob. 21ECh. 15.1 - Prob. 22ECh. 15.1 - Prob. 23ECh. 15.1 - Prob. 24ECh. 15.1 - Prob. 25ECh. 15.1 - In Exercises 15.2215.27, we repeat the information...Ch. 15.1 - Prob. 27ECh. 15.1 - Prob. 28ECh. 15.1 - In Exercises 15.2815.33, a. compute the standard...Ch. 15.1 - Prob. 30ECh. 15.1 - In Exercises 15.2815.33, a. compute the standard...Ch. 15.1 - In Exercises 15.2815.33, a. compute the standard...Ch. 15.1 - In Exercises 15.2815.33, a. compute the standard...Ch. 15.1 - In Exercises 15.3415.43, use the technology of...Ch. 15.1 - In Exercises 15.3415.43, use the technology of...Ch. 15.1 - In Exercises 15.3415.43, use the technology of...Ch. 15.1 - In Exercises 15.3415.43, use the technology of...Ch. 15.1 - Prob. 38ECh. 15.1 - Prob. 39ECh. 15.1 - Prob. 40ECh. 15.1 - Prob. 41ECh. 15.1 - Prob. 42ECh. 15.1 - Prob. 43ECh. 15.2 - Explain why the predictor variable is useless as a...Ch. 15.2 - Prob. 45ECh. 15.2 - Prob. 46ECh. 15.2 - In this section, we used the statistic b1 as a...Ch. 15.2 - In Exercises 15.4815.57, we repeat the information...Ch. 15.2 - Prob. 49ECh. 15.2 - In Exercises 15.4815.57, we repeat the information...Ch. 15.2 - In Exercises 15.4815.57, we repeat the information...Ch. 15.2 - Prob. 52ECh. 15.2 - Prob. 53ECh. 15.2 - Prob. 54ECh. 15.2 - In Exercises 15.4815.57, we repeat the information...Ch. 15.2 - Prob. 56ECh. 15.2 - Prob. 57ECh. 15.2 - Prob. 58ECh. 15.2 - In Exercises 15.5815.63, we repeat the information...Ch. 15.2 - Prob. 60ECh. 15.2 - In Exercises 15.5815.63, we repeat the information...Ch. 15.2 - Prob. 62ECh. 15.2 - In Exercises 15.5815.63, we repeat the information...Ch. 15.2 - Prob. 64ECh. 15.2 - In each of Exercises 15.6415.69, apply Procedure...Ch. 15.2 - In each of Exercises 15.6415.69, apply Procedure...Ch. 15.2 - Prob. 67ECh. 15.2 - Prob. 68ECh. 15.2 - Prob. 69ECh. 15.2 - Prob. 70ECh. 15.2 - In Exercises 15.7015.80, use the technology of...Ch. 15.2 - In Exercises 15.7015.80, use the technology of...Ch. 15.2 - Prob. 73ECh. 15.2 - Prob. 74ECh. 15.2 - Prob. 75ECh. 15.2 - In Exercises 15.7015.80, use the technology of...Ch. 15.2 - Prob. 77ECh. 15.2 - Prob. 78ECh. 15.2 - In Exercises 15.7015.80, use the technology of...Ch. 15.2 - Prob. 80ECh. 15.3 - Without doing any calculations, fill in the blank....Ch. 15.3 - Prob. 82ECh. 15.3 - Prob. 83ECh. 15.3 - Prob. 84ECh. 15.3 - In Exercises 15.8215.91, we repeat the data from...Ch. 15.3 - Prob. 86ECh. 15.3 - Prob. 87ECh. 15.3 - In Exercises 15.8215.91, we repeat the data from...Ch. 15.3 - Prob. 89ECh. 15.3 - Prob. 90ECh. 15.3 - Prob. 91ECh. 15.3 - Prob. 92ECh. 15.3 - In Exercises 15.9215.97, presume that the...Ch. 15.3 - In Exercises 15.9215.97, presume that the...Ch. 15.3 - In Exercises 15.9215.9, presume that the...Ch. 15.3 - Prob. 96ECh. 15.3 - In Exercises 15.9215.97, presume that the...Ch. 15.3 - Prob. 98ECh. 15.3 - In Exercises 15.9815.108, use the technology of...Ch. 15.3 - In Exercises 15.9815.108, use the technology of...Ch. 15.3 - In Exercises 15.9815.108, use the technology of...Ch. 15.3 - In Exercises 15.9815.108, use the technology of...Ch. 15.3 - Prob. 103ECh. 15.3 - Prob. 104ECh. 15.3 - Prob. 105ECh. 15.3 - Prob. 106ECh. 15.3 - In Exercises 15.9815.108, use the technology of...Ch. 15.3 - Prob. 108ECh. 15.3 - Margin of Error in Regression. In Exercises 15.109...Ch. 15.3 - Refer to the confidence interval and prediction...Ch. 15.4 - Identify the statistic used to estimate the...Ch. 15.4 - Prob. 112ECh. 15.4 - Suppose that, for a sample of pairs of...Ch. 15.4 - Prob. 114ECh. 15.4 - Prob. 115ECh. 15.4 - Prob. 116ECh. 15.4 - Prob. 117ECh. 15.4 - Prob. 118ECh. 15.4 - Prob. 119ECh. 15.4 - Prob. 120ECh. 15.4 - Prob. 121ECh. 15.4 - Prob. 122ECh. 15.4 - Prob. 123ECh. 15.4 - Prob. 124ECh. 15.4 - Prob. 125ECh. 15.4 - Prob. 126ECh. 15.4 - Prob. 127ECh. 15.4 - Prob. 128ECh. 15.4 - Prob. 129ECh. 15.4 - Prob. 130ECh. 15.4 - Prob. 131ECh. 15.4 - Prob. 132ECh. 15.4 - Prob. 133ECh. 15.4 - In each of Exercises 15.13415.144, use the...Ch. 15.4 - In each of Exercises 15.13415.144, use the...Ch. 15.4 - Prob. 136ECh. 15.4 - Prob. 137ECh. 15.4 - Prob. 138ECh. 15.4 - Prob. 139ECh. 15.4 - Prob. 140ECh. 15.4 - In each of Exercises 15.13415.144, use the...Ch. 15.4 - Prob. 142ECh. 15.4 - Prob. 143ECh. 15.4 - Prob. 144ECh. 15 - Prob. 1RPCh. 15 - Suppose that x and y are two variables of a...Ch. 15 - What two plots did we use in this chapter to...Ch. 15 - Regarding analysis of residuals, decide in each...Ch. 15 - Suppose that you perform a hypothesis test for the...Ch. 15 - Prob. 6RPCh. 15 - Prob. 7RPCh. 15 - Prob. 8RPCh. 15 - Prob. 9RPCh. 15 - Identify the relationship between two variables...Ch. 15 - Graduation Rates. Graduation ratethe percentage of...Ch. 15 - Prob. 12RPCh. 15 - Prob. 13RPCh. 15 - For Problems 1417, presume that the variables...Ch. 15 - For Problems 1417, presume that the variables...Ch. 15 - For Problems 1417, presume that the variables...Ch. 15 - Prob. 17RPCh. 15 - In Problems 1820, use the technology of your...Ch. 15 - In Problems 1820, use the technology of your...Ch. 15 - In Problems 1820, use the technology of your...Ch. 15 - Recall from Chapter 1 (see page 34) that the Focus...Ch. 15 - At the beginning of this chapter, we presented...
Knowledge Booster


Learn more about
Need a deep-dive on the concept behind this application? Look no further. Learn more about this topic, statistics and related others by exploring similar questions and additional content below.Similar questions
- A researcher developed a regression model to predict the cost of a meal based on the summated rating (sum of ratings for food, decor,and service) and the cost per meal for 12 restaurants. The results of the study show that b1=1.4379 and Sb1=0.1397. a. At the 0.05 level of significance, is there evidence of a linear relationship between the summated rating of a restaurant and the cost of a meal? b. Construct a 95% confidence interval estimate of the population slope, β1. a. Determine the hypotheses for the test. Choose the correct answer below. A. H0: β1=0 H1: β1≠0 B. H0: β0≤0 H1: β0>0 C. H0: β1≤0 H1: β1>0 D. H0: β0≥0 H1: β0<0 E. H0: β1≥0 H1: β1<0 F. H0: β0=0 H1: β0≠0 Compute the test statistic. The test statistic is ? (Round to two decimal places as needed.) Determine the critical value(s). The critical value(s) is(are) ? (Use a comma to separate answers as needed.…arrow_forwardIn exercise 12, the following data on x = average daily hotel room rate and y = amount spent on entertainment (The Wall Street Journal, August 18, 2011) lead to the estimated regression equation ŷ = 17.49 + 1.0334x. For these data SSE = 1541.4. Use Table 1 of Appendix B.Click on the datafile logo to reference the data. a. Predict the amount spent on entertainment for a particular city that has a daily room rate of $89 (to 2 decimals).$ b. Develop a 95% confidence interval for the mean amount spent on entertainment for all cities that have a daily room rate of $89 (to 2 decimals).$ to $ c. The average room rate in Chicago is $128. Develop a 95% prediction interval for the amount spent on entertainment in Chicago (to 2 decimals).$ to $arrow_forwardBased on the sample data set: (0,0) ( 2,3) (3,3) (6,4) (9,8) A. Construct the 90% confidence interval for the slope B1 of the population regression line B. find the Coefficient of determination using the formula r2=B1SSxy / SSyy.arrow_forward
- The following measurements correspond to air velocity and the evaporation coefficient of burned fuel droplets in a boost engine. Construct a 95% confidence interval for the regression coefficient alpha.arrow_forwardIn the macro relation between GDP and FDI, Dr Mudenda obtained the following valuesfrom a Stata output: FDI coefficient of 0.45; t-statistic of 3; and covariance (GDP, FDI)value of 0.41. In literature, this relationship between GDP and FDI has generally beenestablished to be statistically significant. Answer the following questions:i) Calculate the variance of the FDI variable and explain its implicationii) Use the confidence interval approach to test whether FDI’s influence on GDP isstatically significant or not in Dr Mudenda’s study. Use 5% level which gives 1.96critical values.iii) What is the expected value of the p-values for studies that have been conductedin literature?arrow_forwardIn Exercises, presume that the assumptions for regression inferences are met.Study Time and Score. Following are the data on total hours studied over 2 weeks and test score at the end of the 2 weeks from Exercise. x 10 15 12 20 8 16 14 22 y 92 81 84 74 85 80 84 80 a. Determine a point estimate for the mean test score of all beginning calculus students who study for 15 hours.b. Find a 99% confidence interval for the mean test score of all beginning calculus students who study for 15 hours.c. Find the predicted test score of a beginning calculus student who studies for 15 hours.d. Determine a 99% prediction interval for the test score of a beginning calculus student who studies for 15 hours.ExerciseApplying the Concepts and SkillsIn Exercises, we repeat the information from Exercises. For each exercise here, discuss what satisfying Assumptions 1–3 for regression inferences by the variables under consideration would mean.arrow_forward
- Which of the following scatterplots provides evidence that the condition of equal variance for inference for the slope of a regression line has not been met?arrow_forwardUse the following information from a multiple regression analysis. n=15 b1=2 b2=6 Sb1=1.4 Sb2=0.5 a. Which variable has the largest slope, in units of a t statistic? b. Construct a 90% confidence interval estimate of the population slope, β1. c. At the 0.10 level of significance, determine whether each independent variable makes a significant contribution to the regression model. On the basis of these results, indicate the independent variables to include in this model.arrow_forwardThe sample observation below were randomly selected. (a) Determine the regression equation, (b) Determine the expected value of Y if X=9, (c) Determine the 0.90 confidence interval for the mean predicted when X=9, and (d) Determine the 0.90 prediction interval for an individual predicted when X=9. x 4,5,3,6,10 y 4 6 5 7 7arrow_forward
- Using the regression results in column (1):a. Is the college–high school earnings difference estimated from thisregression statistically significant at the 5% level? Construct a 95%confidence interval of the difference.b. Is the male–female earnings difference estimated from this regressionstatistically significant at the 5% level? Construct a 95% confidenceinterval for the differencarrow_forwardIn building an arena, steel bars with a mean ultimate tensile strength of 400 Megapascal (MPa) with a variance of 81 MPa were delivered by the manufactured. The project engineer tested 50 steel bars and found out that the mean ultimate tensile strength is 390 MPa. The decision for the extension of the contract with the manufacturer depends on the engineer. Test the hypothesis whether there is no significant difference between the two means using a two-tailed with a=0.01arrow_forwardRefer to 9.3.4 below and Let X = 1.6 and construct the 95 percent confidence interval for μy|x and construct the 95 percent prediction interval for Y. 9.3.4 Reiss et al. (A-3) compared point-of-care and standard hospital laboratory assays for monitoring patients receiving a single anticoagulant or a regimen consisting of a combination of anticoagulants. It is quite common when comparing two measuring techniques, to use regression analysis in which one variable is used to predict another. In the present study, the researchers obtained measures of international normalized ratio (INR) by assay of capillary and venous blood samples collected from 90 subjects taking warfarin. INR, used especially when patients are receiving warfarin, measures the clotting ability of the blood. Point-of-care testing for INR was conducted with the CoaguChek assay product. Hospital testing was done with standard hospital laboratory assays. The authors used the hospital assay INR level to predict the CoaguChek…arrow_forward
arrow_back_ios
SEE MORE QUESTIONS
arrow_forward_ios
Recommended textbooks for you
 MATLAB: An Introduction with ApplicationsStatisticsISBN:9781119256830Author:Amos GilatPublisher:John Wiley & Sons Inc
 Probability and Statistics for Engineering and th...StatisticsISBN:9781305251809Author:Jay L. DevorePublisher:Cengage Learning
 Statistics for The Behavioral Sciences (MindTap C...StatisticsISBN:9781305504912Author:Frederick J Gravetter, Larry B. WallnauPublisher:Cengage Learning
 Elementary Statistics: Picturing the World (7th E...StatisticsISBN:9780134683416Author:Ron Larson, Betsy FarberPublisher:PEARSON
 The Basic Practice of StatisticsStatisticsISBN:9781319042578Author:David S. Moore, William I. Notz, Michael A. FlignerPublisher:W. H. Freeman
 Introduction to the Practice of StatisticsStatisticsISBN:9781319013387Author:David S. Moore, George P. McCabe, Bruce A. CraigPublisher:W. H. Freeman
MATLAB: An Introduction with Applications
Statistics
ISBN:9781119256830
Author:Amos Gilat
Publisher:John Wiley & Sons Inc
Probability and Statistics for Engineering and th...
Statistics
ISBN:9781305251809
Author:Jay L. Devore
Publisher:Cengage Learning
Statistics for The Behavioral Sciences (MindTap C...
Statistics
ISBN:9781305504912
Author:Frederick J Gravetter, Larry B. Wallnau
Publisher:Cengage Learning
Elementary Statistics: Picturing the World (7th E...
Statistics
ISBN:9780134683416
Author:Ron Larson, Betsy Farber
Publisher:PEARSON
The Basic Practice of Statistics
Statistics
ISBN:9781319042578
Author:David S. Moore, William I. Notz, Michael A. Fligner
Publisher:W. H. Freeman
Introduction to the Practice of Statistics
Statistics
ISBN:9781319013387
Author:David S. Moore, George P. McCabe, Bruce A. Craig
Publisher:W. H. Freeman
Hypothesis Testing using Confidence Interval Approach; Author: BUM2413 Applied Statistics UMP;https://www.youtube.com/watch?v=Hq1l3e9pLyY;License: Standard YouTube License, CC-BY
Hypothesis Testing - Difference of Two Means - Student's -Distribution & Normal Distribution; Author: The Organic Chemistry Tutor;https://www.youtube.com/watch?v=UcZwyzwWU7o;License: Standard Youtube License