
Introductory Statistics (10th Edition)
10th Edition
ISBN: 9780321989178
Author: Neil A. Weiss
Publisher: PEARSON
expand_more
expand_more
format_list_bulleted
Videos
Textbook Question
Chapter 15.2, Problem 63E
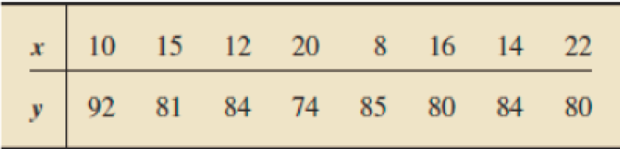
In Exercises 15.58–15.63, we repeat the information from Exercises 15.22–15.27. Presuming that the assumptions for regression inferences are met, decide at the specified significance level whether the data provide sufficient evidence to conclude that the predictor variable is useful for predicting the response variable.
15.63 Study Time and Score. Following are the data on total hours studied over 2 weeks and test score at the end of the 2 weeks from Exercise 15.27. Use α =0.01.
Expert Solution & Answer
Want to see the full answer?
Check out a sample textbook solution
Students have asked these similar questions
A researcher developed a regression model to predict the cost of a meal based on the summated rating (sum of ratings for food, decor,and service) and the cost per meal for 12 restaurants. The results of the study show that
b1=1.4379 and Sb1=0.1397.
a. At the 0.05 level of significance, is there evidence of a linear relationship between the summated rating of a restaurant and the cost of a meal?
b. Construct a 95% confidence interval estimate of the population slope,
β1.
a. Determine the hypotheses for the test. Choose the correct answer below.
A.
H0:
β1=0
H1:
β1≠0
B.
H0:
β0≤0
H1:
β0>0
C.
H0:
β1≤0
H1:
β1>0
D.
H0:
β0≥0
H1:
β0<0
E.
H0:
β1≥0
H1:
β1<0
F.
H0:
β0=0
H1:
β0≠0
Compute the test statistic.
The test statistic is ?
(Round to two decimal places as needed.)
Determine the critical value(s).
The critical value(s) is(are) ?
(Use a comma to separate answers as needed.…
A random sample of 15 college soccer players were selected to investigate the relationship between heart rate and maximal oxygen uptake. The heart rate and maximal oxygen uptake were recorded for each player during a training session. A regression analysis of the data was conducted, where heart rate is the explanatory variable and maximal oxygen uptake is the response variable.
If a 95 percent confidence interval is constructed for the slope of the population regression line, which of the following is a condition that must be checked?
A)The true relationship between heart rate and maximal oxygen uptake is linear.
B)The correlation between heart rate and maximal oxygen uptake is not equal to zero.
C)The confidence interval is not biased.
D).The point (x_,y_) falls on the regression line. The X and Y have a line on top.
E)The slope is not equal to zero.
In exercise 12, the following data on x = average daily hotel room rate and y = amount spent on entertainment (The Wall Street Journal, August 18, 2011) lead to the estimated regression equation ŷ = 17.49 + 1.0334x. For these data SSE = 1541.4.Click on the datafile logo to reference the data. Use Table 1 of Appendix B.
a. Predict the amount spent on entertainment for a particular city that has a daily room rate of $89 (to 2 decimals).$
b. Develop a 95% confidence interval for the mean amount spent on entertainment for all cities that have a daily room rate of $89 (to 2 decimals).$ to $
c. The average room rate in Chicago is $128. Develop a 95% prediction interval for the amount spent on entertainment in Chicago (to 2 decimals).
Chapter 15 Solutions
Introductory Statistics (10th Edition)
Ch. 15.1 - Suppose that x and y are predictor and response...Ch. 15.1 - Prob. 2ECh. 15.1 - Prob. 3ECh. 15.1 - Prob. 4ECh. 15.1 - Prob. 5ECh. 15.1 - In Exercises 15.315.6, assume that the variables...Ch. 15.1 - The difference between an observed value and a...Ch. 15.1 - Identify two graphs used in a residual analysis to...Ch. 15.1 - Which graph used in a residual analysis provides...Ch. 15.1 - Figure 15.8 shows three residual plots and a...
Ch. 15.1 - Figure 15.9 on the next page shows three residual...Ch. 15.1 - In Exercises 15.1215.21, we repeat the data and...Ch. 15.1 - In Exercises 15.1215.21, we repeat the data and...Ch. 15.1 - Prob. 14ECh. 15.1 - Prob. 15ECh. 15.1 - Prob. 16ECh. 15.1 - Prob. 17ECh. 15.1 - Prob. 18ECh. 15.1 - Prob. 19ECh. 15.1 - Prob. 20ECh. 15.1 - Prob. 21ECh. 15.1 - Prob. 22ECh. 15.1 - Prob. 23ECh. 15.1 - Prob. 24ECh. 15.1 - Prob. 25ECh. 15.1 - In Exercises 15.2215.27, we repeat the information...Ch. 15.1 - Prob. 27ECh. 15.1 - Prob. 28ECh. 15.1 - In Exercises 15.2815.33, a. compute the standard...Ch. 15.1 - Prob. 30ECh. 15.1 - In Exercises 15.2815.33, a. compute the standard...Ch. 15.1 - In Exercises 15.2815.33, a. compute the standard...Ch. 15.1 - In Exercises 15.2815.33, a. compute the standard...Ch. 15.1 - In Exercises 15.3415.43, use the technology of...Ch. 15.1 - In Exercises 15.3415.43, use the technology of...Ch. 15.1 - In Exercises 15.3415.43, use the technology of...Ch. 15.1 - In Exercises 15.3415.43, use the technology of...Ch. 15.1 - Prob. 38ECh. 15.1 - Prob. 39ECh. 15.1 - Prob. 40ECh. 15.1 - Prob. 41ECh. 15.1 - Prob. 42ECh. 15.1 - Prob. 43ECh. 15.2 - Explain why the predictor variable is useless as a...Ch. 15.2 - Prob. 45ECh. 15.2 - Prob. 46ECh. 15.2 - In this section, we used the statistic b1 as a...Ch. 15.2 - In Exercises 15.4815.57, we repeat the information...Ch. 15.2 - Prob. 49ECh. 15.2 - In Exercises 15.4815.57, we repeat the information...Ch. 15.2 - In Exercises 15.4815.57, we repeat the information...Ch. 15.2 - Prob. 52ECh. 15.2 - Prob. 53ECh. 15.2 - Prob. 54ECh. 15.2 - In Exercises 15.4815.57, we repeat the information...Ch. 15.2 - Prob. 56ECh. 15.2 - Prob. 57ECh. 15.2 - Prob. 58ECh. 15.2 - In Exercises 15.5815.63, we repeat the information...Ch. 15.2 - Prob. 60ECh. 15.2 - In Exercises 15.5815.63, we repeat the information...Ch. 15.2 - Prob. 62ECh. 15.2 - In Exercises 15.5815.63, we repeat the information...Ch. 15.2 - Prob. 64ECh. 15.2 - In each of Exercises 15.6415.69, apply Procedure...Ch. 15.2 - In each of Exercises 15.6415.69, apply Procedure...Ch. 15.2 - Prob. 67ECh. 15.2 - Prob. 68ECh. 15.2 - Prob. 69ECh. 15.2 - Prob. 70ECh. 15.2 - In Exercises 15.7015.80, use the technology of...Ch. 15.2 - In Exercises 15.7015.80, use the technology of...Ch. 15.2 - Prob. 73ECh. 15.2 - Prob. 74ECh. 15.2 - Prob. 75ECh. 15.2 - In Exercises 15.7015.80, use the technology of...Ch. 15.2 - Prob. 77ECh. 15.2 - Prob. 78ECh. 15.2 - In Exercises 15.7015.80, use the technology of...Ch. 15.2 - Prob. 80ECh. 15.3 - Without doing any calculations, fill in the blank....Ch. 15.3 - Prob. 82ECh. 15.3 - Prob. 83ECh. 15.3 - Prob. 84ECh. 15.3 - In Exercises 15.8215.91, we repeat the data from...Ch. 15.3 - Prob. 86ECh. 15.3 - Prob. 87ECh. 15.3 - In Exercises 15.8215.91, we repeat the data from...Ch. 15.3 - Prob. 89ECh. 15.3 - Prob. 90ECh. 15.3 - Prob. 91ECh. 15.3 - Prob. 92ECh. 15.3 - In Exercises 15.9215.97, presume that the...Ch. 15.3 - In Exercises 15.9215.97, presume that the...Ch. 15.3 - In Exercises 15.9215.9, presume that the...Ch. 15.3 - Prob. 96ECh. 15.3 - In Exercises 15.9215.97, presume that the...Ch. 15.3 - Prob. 98ECh. 15.3 - In Exercises 15.9815.108, use the technology of...Ch. 15.3 - In Exercises 15.9815.108, use the technology of...Ch. 15.3 - In Exercises 15.9815.108, use the technology of...Ch. 15.3 - In Exercises 15.9815.108, use the technology of...Ch. 15.3 - Prob. 103ECh. 15.3 - Prob. 104ECh. 15.3 - Prob. 105ECh. 15.3 - Prob. 106ECh. 15.3 - In Exercises 15.9815.108, use the technology of...Ch. 15.3 - Prob. 108ECh. 15.3 - Margin of Error in Regression. In Exercises 15.109...Ch. 15.3 - Refer to the confidence interval and prediction...Ch. 15.4 - Identify the statistic used to estimate the...Ch. 15.4 - Prob. 112ECh. 15.4 - Suppose that, for a sample of pairs of...Ch. 15.4 - Prob. 114ECh. 15.4 - Prob. 115ECh. 15.4 - Prob. 116ECh. 15.4 - Prob. 117ECh. 15.4 - Prob. 118ECh. 15.4 - Prob. 119ECh. 15.4 - Prob. 120ECh. 15.4 - Prob. 121ECh. 15.4 - Prob. 122ECh. 15.4 - Prob. 123ECh. 15.4 - Prob. 124ECh. 15.4 - Prob. 125ECh. 15.4 - Prob. 126ECh. 15.4 - Prob. 127ECh. 15.4 - Prob. 128ECh. 15.4 - Prob. 129ECh. 15.4 - Prob. 130ECh. 15.4 - Prob. 131ECh. 15.4 - Prob. 132ECh. 15.4 - Prob. 133ECh. 15.4 - In each of Exercises 15.13415.144, use the...Ch. 15.4 - In each of Exercises 15.13415.144, use the...Ch. 15.4 - Prob. 136ECh. 15.4 - Prob. 137ECh. 15.4 - Prob. 138ECh. 15.4 - Prob. 139ECh. 15.4 - Prob. 140ECh. 15.4 - In each of Exercises 15.13415.144, use the...Ch. 15.4 - Prob. 142ECh. 15.4 - Prob. 143ECh. 15.4 - Prob. 144ECh. 15 - Prob. 1RPCh. 15 - Suppose that x and y are two variables of a...Ch. 15 - What two plots did we use in this chapter to...Ch. 15 - Regarding analysis of residuals, decide in each...Ch. 15 - Suppose that you perform a hypothesis test for the...Ch. 15 - Prob. 6RPCh. 15 - Prob. 7RPCh. 15 - Prob. 8RPCh. 15 - Prob. 9RPCh. 15 - Identify the relationship between two variables...Ch. 15 - Graduation Rates. Graduation ratethe percentage of...Ch. 15 - Prob. 12RPCh. 15 - Prob. 13RPCh. 15 - For Problems 1417, presume that the variables...Ch. 15 - For Problems 1417, presume that the variables...Ch. 15 - For Problems 1417, presume that the variables...Ch. 15 - Prob. 17RPCh. 15 - In Problems 1820, use the technology of your...Ch. 15 - In Problems 1820, use the technology of your...Ch. 15 - In Problems 1820, use the technology of your...Ch. 15 - Recall from Chapter 1 (see page 34) that the Focus...Ch. 15 - At the beginning of this chapter, we presented...
Knowledge Booster


Learn more about
Need a deep-dive on the concept behind this application? Look no further. Learn more about this topic, statistics and related others by exploring similar questions and additional content below.Similar questions
- In exercise 12, the following data on x = average daily hotel room rate and y = amount spent on entertainment (The Wall Street Journal, August 18, 2011) lead to the estimated regression equation ŷ = 17.49 + 1.0334x. For these data SSE = 1541.4. Use Table 1 of Appendix B.Click on the datafile logo to reference the data. a. Predict the amount spent on entertainment for a particular city that has a daily room rate of $89 (to 2 decimals).$ b. Develop a 95% confidence interval for the mean amount spent on entertainment for all cities that have a daily room rate of $89 (to 2 decimals).$ to $ c. The average room rate in Chicago is $128. Develop a 95% prediction interval for the amount spent on entertainment in Chicago (to 2 decimals).$ to $arrow_forwardA regression analysis was conducted to investigate the relationship between the total charge and travel time for a certain car service. Computer output from a linear regression analysis is shown below. The analysis was performed on a sample of 24 observations. Term CoefCoef SE CoefSE Coef Constant −1.55−1.55 0.945 Travel time 0.22 0.023 Assume that the conditions for inference for the slope of the regression equation have been met. Which of the following defines the margin of error of a 90 percent confidence interval for the slope of the least-squares regression line? 1.321(0.945)1.321(0.945) A 1.717(0.945)1.717(0.945) B 1.717(0.22)1.717(0.22) C 1.321(0.023)1.321(0.023) D 1.717(0.023) Earrow_forwardIn Exercises, assume that the variables under consideration satisfy the assumptions for regression inferences. Based on a sample of data points, what is the best estimate of the population regression line?arrow_forward
- Suppose the following data were collected from a sample of 15 houses relating selling price to square footage and the architectural style of the house. Use statistical software to find the following regression equation: PRICEi=b0+b1SQFTi+b2COLONIALi+b3RANCHi+ei . Is there enough evidence to support the claim that on average, houses that are ranch style have lower selling prices than houses that are Victorian style at the 0.05 level of significance? If yes, write the regression equation in the spaces provided with answers rounded to two decimal places. Else, select "There is not enough evidence."Selling Price Square Footage Colonial (1 if house is Colonial style, 0 otherwise) Ranch (1 if house is Ranch style, 0 otherwise) Victorian (1 if house is Victorian style, 0 otherwise) 377640 1941 1 0 0 460996 3397 0 1 0 405781 2764 0 0 1 407216 2906 0 0 1 435139 3401 1 0 0 405275 2600 0 0 1 381141 2203 0 1 0 370490 2046 1 0 0 404070 2210 0 0 1 460196 3692 0 1 0 382780 2172 1 0 0 406466 2606 0 1…arrow_forwardExercise 3.2 85 of an independent random sample of 180 large retailers and 45 of an independent random sample of 175 small retailers used the regression analysis method as the estimation method. Obtain the 95% confidence interval for the difference between the two population ratios. Thank you so much.arrow_forwardA study was conducted to see whether heart rate (y) on swimmers linearly related to their age (x1) and swimming time for 2000 meters (x2). A random sample of ten swimmers was selected and the result is shown in the following Microsoft Excel output. (a)Interpret the value of R2 from the output. (b)Conduct a hypothesis test to test whether the linear regression model is fit or not using a = 0.05. (c)Calculate the 95% confidence interval for the coefficient value for age.arrow_forward
- A study was conducted to see whether heart rate (y) on swimmers linearly related to their age (x1) and swimming time for 2000 meters (x2). A random sample of ten swimmers was selected and the result is shown in the following Microsoft Excel output. (a) Interpret the value of R2 from the output. (b) Conduct a hypothesis test to test whether the linear regression model is fit or not using a = 0.05. (c) Calculate the 95% confidence interval for the coefficient value for age.arrow_forwardYears of Work Experience and number of Job Offers of 10 job-seekers were as follows: Work Exp. 4 2 5 3 7 12 2 5 4 9 No. of Offers 7 1 8 4 13 19 3 11 9 15 a. Fit the regression equation of No. of Job Offers on Years of Work Experience. b. What will be the predicted number of offers for an applicant with 6 years of experience? c. Verify the relationship between the number of job offers and years of work experience using at least two relevant methodsarrow_forwardThe Mayor of texas whom is partners with a local agriculturalist wants to know how the amount of fertilizer and the amount of water given to plants affect their growth. The results were inputted into MINITAB so as to fit the model a) Write out the regression equation b) What is the sample size used in this investigation? c) Determine the values of *, ** and ***, **** d) Conduct a hypothesis test, at the 5% level of significance, to determine whether ? is significant. e) What would be the growth of the plant if 4g of fertilizer and 7g of ater was given to it daily? f) Carry out an F -test at the 1% significance level to determine whether the model is significantarrow_forward
- (1) Conduct a hypothesis test, at the 5% level of significance, to determine whether ? is significant (2) What would be the growth of the plant if 4g of fertilizer and 7g of ater was given to it daily? (3) Carry out an F -test at the 1% significance level to determine whether the model is significantarrow_forwarda) Calculate the least square regression line for X on Y of the given data?b) Calculate the coefficient of correlation of the given date? Interpret the value of the coefficient?arrow_forwardBased on the sample data set: (0,0) ( 2,3) (3,3) (6,4) (9,8) A. Construct the 90% confidence interval for the slope B1 of the population regression line B. find the Coefficient of determination using the formula r2=B1SSxy / SSyy.arrow_forward
arrow_back_ios
SEE MORE QUESTIONS
arrow_forward_ios
Recommended textbooks for you
 MATLAB: An Introduction with ApplicationsStatisticsISBN:9781119256830Author:Amos GilatPublisher:John Wiley & Sons Inc
 Probability and Statistics for Engineering and th...StatisticsISBN:9781305251809Author:Jay L. DevorePublisher:Cengage Learning
 Statistics for The Behavioral Sciences (MindTap C...StatisticsISBN:9781305504912Author:Frederick J Gravetter, Larry B. WallnauPublisher:Cengage Learning
 Elementary Statistics: Picturing the World (7th E...StatisticsISBN:9780134683416Author:Ron Larson, Betsy FarberPublisher:PEARSON
 The Basic Practice of StatisticsStatisticsISBN:9781319042578Author:David S. Moore, William I. Notz, Michael A. FlignerPublisher:W. H. Freeman
 Introduction to the Practice of StatisticsStatisticsISBN:9781319013387Author:David S. Moore, George P. McCabe, Bruce A. CraigPublisher:W. H. Freeman
MATLAB: An Introduction with Applications
Statistics
ISBN:9781119256830
Author:Amos Gilat
Publisher:John Wiley & Sons Inc
Probability and Statistics for Engineering and th...
Statistics
ISBN:9781305251809
Author:Jay L. Devore
Publisher:Cengage Learning
Statistics for The Behavioral Sciences (MindTap C...
Statistics
ISBN:9781305504912
Author:Frederick J Gravetter, Larry B. Wallnau
Publisher:Cengage Learning
Elementary Statistics: Picturing the World (7th E...
Statistics
ISBN:9780134683416
Author:Ron Larson, Betsy Farber
Publisher:PEARSON
The Basic Practice of Statistics
Statistics
ISBN:9781319042578
Author:David S. Moore, William I. Notz, Michael A. Fligner
Publisher:W. H. Freeman
Introduction to the Practice of Statistics
Statistics
ISBN:9781319013387
Author:David S. Moore, George P. McCabe, Bruce A. Craig
Publisher:W. H. Freeman
Hypothesis Testing using Confidence Interval Approach; Author: BUM2413 Applied Statistics UMP;https://www.youtube.com/watch?v=Hq1l3e9pLyY;License: Standard YouTube License, CC-BY
Hypothesis Testing - Difference of Two Means - Student's -Distribution & Normal Distribution; Author: The Organic Chemistry Tutor;https://www.youtube.com/watch?v=UcZwyzwWU7o;License: Standard Youtube License