Concept explainers
Videos
To graph: The
Explanation of Solution
Given information:
The data of sales of single family homes for 6 consecutive months is provided below,
Graph:
Consider the data of sales of single family homes for 6 consecutive months that is provided below,
On the Cartesian plane, the x -axis represent median price and y -axis denote the number sold in thousands
Plot the ordered pairs on the Cartesian plane.
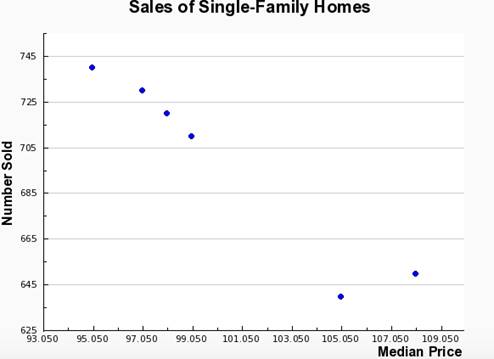
Interpretation:
It is observed that as the median price increases the number sold in thousands decreases. Points seems to be collinear.
Therefore, there is a high
Chapter 15 Solutions
Algebra and Trigonometry: Structure and Method, Book 2
Additional Math Textbook Solutions
College Algebra
Elementary Algebra
Introductory and Intermediate Algebra for College Students (5th Edition)
College Algebra in Context with Applications for the Managerial, Life, and Social Sciences (5th Edition)
College Algebra (10th Edition)
Differential Equations and Linear Algebra (4th Edition)


 Algebra and Trigonometry (6th Edition)AlgebraISBN:9780134463216Author:Robert F. BlitzerPublisher:PEARSON
 Contemporary Abstract AlgebraAlgebraISBN:9781305657960Author:Joseph GallianPublisher:Cengage Learning
 Linear Algebra: A Modern IntroductionAlgebraISBN:9781285463247Author:David PoolePublisher:Cengage Learning
 Algebra And Trigonometry (11th Edition)AlgebraISBN:9780135163078Author:Michael SullivanPublisher:PEARSON
 Introduction to Linear Algebra, Fifth EditionAlgebraISBN:9780980232776Author:Gilbert StrangPublisher:Wellesley-Cambridge Press
 College Algebra (Collegiate Math)AlgebraISBN:9780077836344Author:Julie Miller, Donna GerkenPublisher:McGraw-Hill Education