
Videos
Testing Significance in Theater Revenue. Refer to exercise 5.
- a. Use α = .01 to test the hypotheses
for the model y = β0 + β1x1 + β2x2 + ϵ, where
- b. Use α = .05 to test the significance of β1. Should x1 be dropped from the model?
- c. Use α = .05 to test the significance of β2. Should x2 be dropped from the model?
5. Theater Revenue. The owner of Showtime Movie Theaters, Inc., would like to predict weekly gross revenue as a
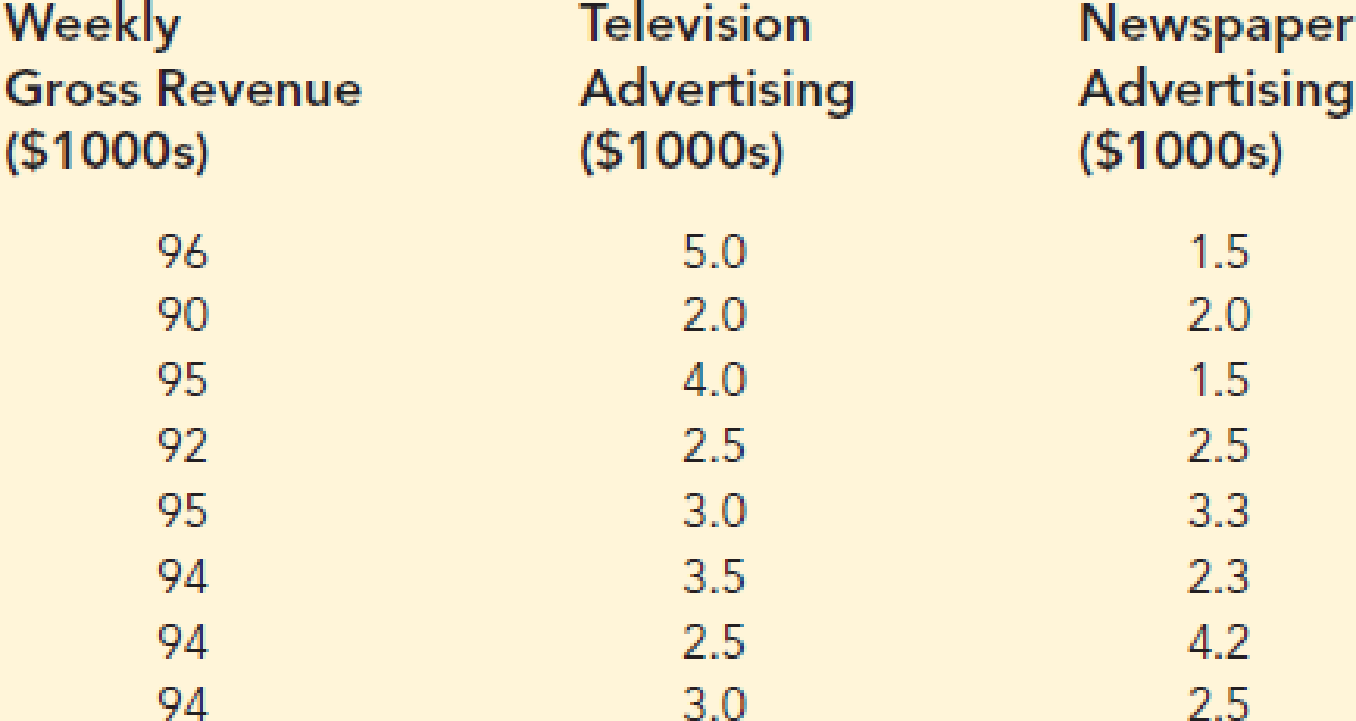
- a. Develop an estimated regression equation with the amount of television advertising as the independent variable.
- b. Develop an estimated regression equation with both television advertising and newspaper advertising as the independent variables.
- c. Is the estimated regression equation coefficient for television advertising expenditures the same in part (a) and in part (b)? Interpret the coefficient in each case.
- d. Predict weekly gross revenue for a week when $3500 is spent on television advertising and $2300 is spent on newspaper advertising.

Trending nowThis is a popular solution!

Chapter 15 Solutions
Essentials Of Statistics For Business & Economics


- Let Y = β0 + β1x + E be the simple linear regression model. Suppose we observe a set of paired data and we estimate the simple linear regression model by using the least squares method. Also suppose, when assessing the model, we want to test whether there is a linear relationship between the explanatory variable X and the response variable Y? What is the null and alternative hypothesis for this test? Select one: a. H0:β1=0vsHa:β1<0H0:β1=0vsHa:β1<0 b. H0:β0=0vsHa:β0≠0H0:β0=0vsHa:β0≠0 c. H0:β1=0vsHa:β1≠0H0:β1=0vsHa:β1≠0 d. H0:β1=0vsHa:β1>0arrow_forward11) A simple linear regression model based on 20 observations. The F-stat for the model is 21.44 and the SSE is 1.41. The standard error for the coefficient of X is 0.2. a) Complete the ANOVA table. b) Find the t-stat of the co-efficient of X c) Find the co-efficient of X.arrow_forward1. Which variables were significant in your model? (Use an alpha of 1% to draw your conclusions.) 2. In the regression model you ran, the binary variables were defined as Female = 0, Male = 1. Using ONLY the information from your regression output, write the regression equation for a model with the OPPOSITE definition of the binary variables (Male = 0, Female = 1).arrow_forward
- Multiple Regression and Correlation Use exel to compute. Σy = nbo + Σx1b1 + Σx2b2 Σx1y = Σx1bo + Σx12b1 + (Σx1x2)b2 Σx2y = Σx2bo + (Σx1x2)b1 + Σx22b2 a) Use the least square equation to predict income given ages=21 & 45 & experience=0 & 5. b) Compute for multiple correlation coefficient. Age 31 37 28 42 33 25 35 40 Experience 4 1 5 4 3 3 2 2 Income 35400 41200 45000 40300 36800 43200 41600 38700arrow_forwardBUS – 173 (Applied Statistics) # Determining if the following statement are True and False. If False, write the correct statement. Also Solve the MCQ 01. In the simple linear regression model, b represents the (a) least square estimate of A (b) least square estimate of B (c) Random error term (d) Not given 02. In the Simple linear regression model, components of the random error term have fixed mean zero. (a) True (b) Falsearrow_forwardTravel Passengers 1 405 2 410 3 420 4 415 5 412 6 420 7 424 8 433 9 438 10 440 11 446 12 451 13 455 14 464 15 466 16 474 17 476 18 482 Use regression analysis to estimate the line of best fit -use the manual method with the formulas shown below. y = a+ bx Where: b = n∑xy-∑x∑y / n∑x2 - (∑x)2 a = y - bxarrow_forward
- Iron Deficiency? Iron is essential to most life forms and to normal human physiology. It is an integral part of many proteins and enzymes that maintain good health. Recommendations for iron are provided in Dietary Reference Intakes, developed by the Institute of Medicine of the National Academy of Sciences. The recommended dietary allowance (RDA) of iron for adult females under the age of 51 years is 18 milligrams (mg) per day. A hypothesis test is to be performed to decide whether adult females under the age of 51 years are, on average, getting less than the RDA of 18 mg of iron. a. determine the null hypothesis. b. determine the alternative hypothesis. c. classify the hypothesis test as two tailed, left tailed, or right tailed.arrow_forwardIron Deficiency? Iron is essential to most life forms and to normal human physiology. It is an integral part of many proteins and enzymes that maintain good health. Recommendations for iron are provided in Dietary Reference Intakes, developed by the Institute of Medicine of the National Academy of Sciences. The recommended dietary allowance (RDA) of iron for adult females under the age of 51 years is 18 milligrams (mg) per day. A hypothesis test is to be performed to decide whether adult females under the age of 51 years are, on average, getting less than the RDA of 18 mg of iron.arrow_forwardFalse negative error A) Both are correct B) The data DO NOT SUPPORT a hypothesis, when in fact the hypothesis is TRUE C) None of the choices D) Alpha errorarrow_forward
- Survey: Reaction to Poison Ivy Allergic reactions to poison ivy can bemiserable. Plant oils cause the reaction. Researchers at Allergy Institutedid a study to determine the effects of washing the oil off within 5minutes of exposure. A random sample of 1000 people with knownallergies to poison ivy participated in the study. Oil from the poison ivyplant was rubbed on a patch of skin. For 500 of the subjects, it was washed off within 5 minutes. For the other 500 subjects, the oil waswashed off after 5 minutes. The results are summarized in Table 5-5. TABLE 5-5 Time Within Which Oil Was Washed off Reaction Within 5 Minutes after 5 Minutes Row Total NoneMildStrongColumn Total 4206020500 50330120500 4703901401000 Let's use the following notation for the various events: W= washing oiloff within 5 minute. A = washing oil off after 5 minutes. N= no reaction. M= mild reaction. S= strong reaction. Find the following probabilitiesfor a person selected at random from this sample of 1000…arrow_forwardBUS – 173 (Applied Statistics) # Determining if the following statement are True and False. If False, write the correct statement. Also Solve the MCQ 01. The possible range of coefficient of correlation (r) is -1 to +1 (a) True (b) False 02. In the simple linear regression model, b represents the (a) least square estimate of A (b) least square estimate of B (c) Random error term (d) Not given 03. In the Simple linear regression model, components of the random error term have fixed mean zero. (a) True (b) Falsearrow_forwardConsider the one-variable regression model Yi = β0 + β1Xi + ui, and suppose it satisfies the least squares assumptions in Key Concept 4.3. Suppose Yi is measured with error, so the data are ?"i = Yi + wi, where wi is the measurement error, which is i.i.d. and independent of Yi. Consider the population regression ?"i = β0 + β1Xi + vi, where vi is the regression error, using the mismeasured dependent variable ?"i.a) Showthatvi =ui +wi.b) Show that the regression ?"i = β0 + β1Xi + vi satisfies the least squares assumptions in KeyConcept 4.3. (Assume that wi is independent of Yj and Xj for all values of i and j and has afinite fourth moment.)c) Are the OLS estimators consistent? part b in another questionarrow_forward
 Elementary Linear Algebra (MindTap Course List)AlgebraISBN:9781305658004Author:Ron LarsonPublisher:Cengage Learning
 Algebra & Trigonometry with Analytic GeometryAlgebraISBN:9781133382119Author:SwokowskiPublisher:Cengage
 Linear Algebra: A Modern IntroductionAlgebraISBN:9781285463247Author:David PoolePublisher:Cengage Learning