
Concept explainers
Videos
Analyzing Job Satisfaction. Recall that in exercise 50 the personnel director for Electronics Associates developed the following estimated regression equation relating an employee’s score on a job satisfaction test to length of service and wage rate.
where
A portion of the associated computer output follows.
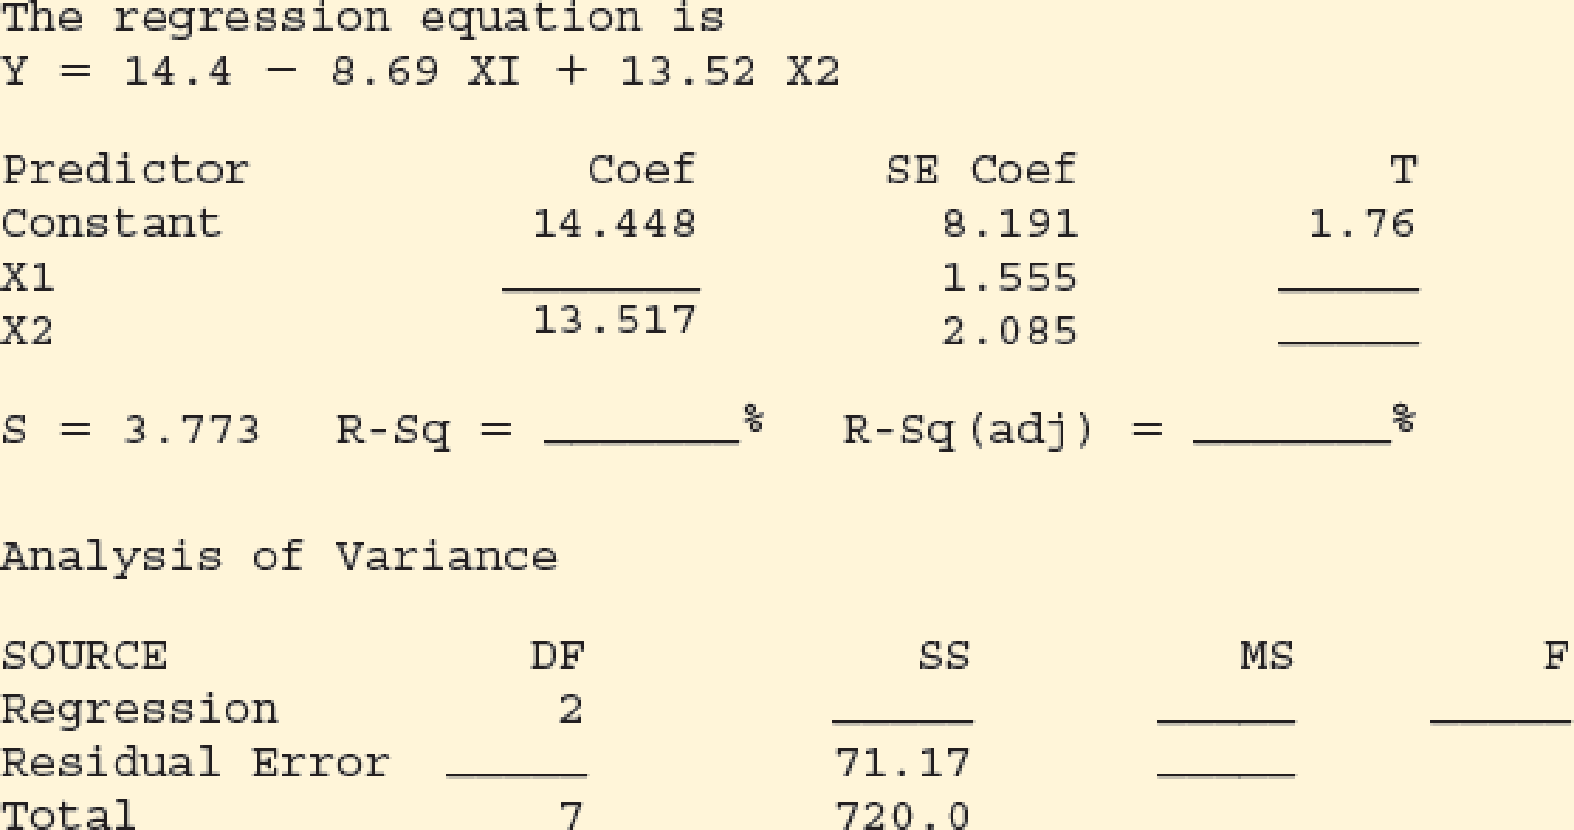
- a. Complete the missing entries in this output.
- b. Compute F and test using α = .05 to see whether a significant relationship is present.
- c. Did the estimated regression equation provide a good fit to the data? Explain.
- d. Use the t test and α = .05 to test H0: β1 = 0 and H0: β2 = 0.
Want to see the full answer?
Check out a sample textbook solution
Chapter 15 Solutions
Essentials Of Statistics For Business & Economics


- What is regression analysis? Describe the process of performing regression analysis on a graphing utility.arrow_forwardIf your graphing calculator is capable of computing a least-squares sinusoidal regression model, use it to find a second model for the data. Graph this new equation along with your first model. How do they compare?arrow_forwardWhy do we have in general, two lines of regression? Obtain the regression of Y on X and X on Y from the following table and estimate the blood pressure when the age is 45. Also give the interpretation.arrow_forward
- A researcher investigated the relationship between family income and savings. Using data from 15 families, the computed r between income and savings was found to be 0.76. The researcher wants to test if there is a significant relationship between the two variables at 5% level of significance and create a regression equation to predict the possible savings given the income of the family. Interpret the computed r value. Test if there is a significant relationship between the two variables at 5% level of significancearrow_forwardAn automotive sales manager wishes to examine the relationship between age (years) and sales price ($) for used automobiles of a certain brand. The accompanying table contains data for a sample of a certain make and model that were listed for sale at a car shopping website. b. Fit a quadratic regression model to predict price and state the quadratic regression equation.arrow_forwardDevelop a simple linear regression equation for starting salaries using an independent variable that has the closest relationship with the salaries. Explain how you chose this variable.arrow_forward
- Find the regression equation, letting the first variable be the predictor (x) variable. Using the listed lemon/crash data, where lemon imports are in metric tons and the fatality rates are per 100,000 people, find the best predicted crash fatality rate for a year in which there are 500 metric tons of lemon imports. Is the prediction worthwhile? Find the equation of the regression line. (Round the constant three decimal places as needed. Round the coefficient to six decimal places as needed.) The best predicted crash fatality rate for a year in which there are 500 metric tons of lemon imports is _______ fatalities per 100,000 population. (Round to one decimal place as needed.) Is the prediction worthwhile? A. Since the sample size is small, the prediction is not appropriate. B. Since common sense suggests there should not be much of a relationship between the two variables, the prediction does not make much sense. C. Since all of the requirements…arrow_forwardAt a .01 level of significance is there sufficient evidence to conclude that the number of books sold is related to the number of registered students in a straight-line manner, and give the regression equation.arrow_forwardA researcher has determined that the correlation between a persons age and their score on a happiness questionnaire is 0.58 The researcher developed the following regression model: Y=13+4x For every year of age a persons score on the questionnaire is expected to increase by how many points?arrow_forward
- Let X = height of the students in inches Let Y = Foot length of the students in centimeters Complete manual solutions for the SLRM coefficients, their interpretations and write down the best fitting linear regression equation. What is the predicted value of foot when height = 75?arrow_forwardA study in the univeristy of massachusetts amherst published in the may 2007 journal of marriage and family found that married women do about one fewer hour of housework a week for every $7500 they earn as a full time workers outside of the home, regardless of their husband's income A) what would be the numerical value of the slope coefficient in the regression model that predicts womens housework hours from their income? what does the sign of the slope (positive or negative) tell us about the relationship between these variables B) Suppose Lynette's salary is $30,000 greater than Gabriells. what would you predict the difference in hours of housework they each do.arrow_forwardb. Find the equation of regression line between radiation doses on exposure time .usingleast square method.arrow_forward
 Trigonometry (MindTap Course List)TrigonometryISBN:9781305652224Author:Charles P. McKeague, Mark D. TurnerPublisher:Cengage Learning
 Glencoe Algebra 1, Student Edition, 9780079039897...AlgebraISBN:9780079039897Author:CarterPublisher:McGraw Hill
 Algebra & Trigonometry with Analytic GeometryAlgebraISBN:9781133382119Author:SwokowskiPublisher:Cengage
 Algebra and Trigonometry (MindTap Course List)AlgebraISBN:9781305071742Author:James Stewart, Lothar Redlin, Saleem WatsonPublisher:Cengage Learning