
Modern Business Statistics with Microsoft Office Excel (with XLSTAT Education Edition Printed Access Card) (MindTap Course List)
6th Edition
ISBN: 9781337115186
Author: David R. Anderson, Dennis J. Sweeney, Thomas A. Williams, Jeffrey D. Camm, James J. Cochran
Publisher: Cengage Learning
expand_more
expand_more
format_list_bulleted
Concept explainers
Videos
Textbook Question
Chapter 16.1, Problem 6E
A study of emergency service facilities investigated the relationship between the number of facilities and the average distance traveled to provide the emergency service. The following table gives the data collected.
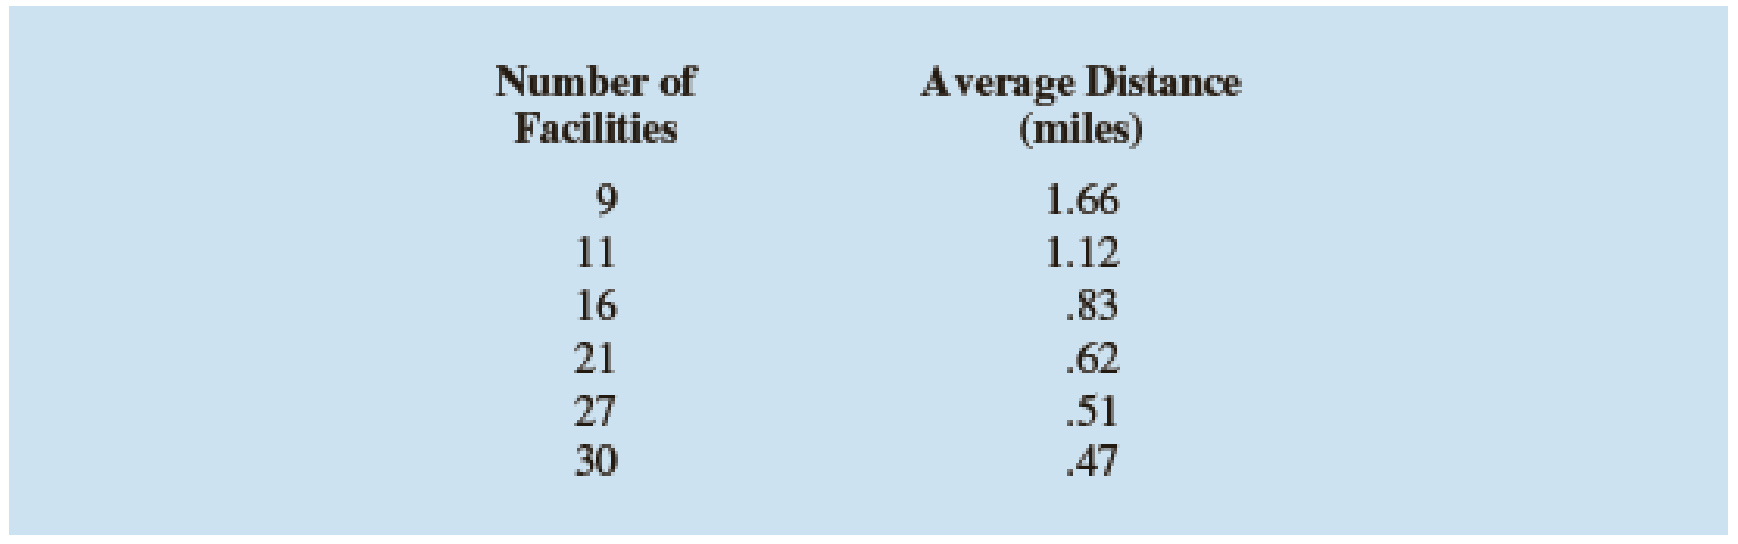
- a. Develop a
scatter diagram for these data, treating average distance traveled as the dependent variable. - b. Does a simple linear model appear to be appropriate? Explain.
- c. Develop an estimated regression equation for the data that you believe will best explain the relationship between these two variables.
Expert Solution & Answer
Want to see the full answer?
Check out a sample textbook solution
Chapter 16 Solutions
Modern Business Statistics with Microsoft Office Excel (with XLSTAT Education Edition Printed Access Card) (MindTap Course List)
Ch. 16.1 - Consider the following data for two variables, x...Ch. 16.1 - Consider the following data for two variables, x...Ch. 16.1 - Prob. 3ECh. 16.1 - A highway department is studying the relationship...Ch. 16.1 - In working further with the problem of exercise 4,...Ch. 16.1 - A study of emergency service facilities...Ch. 16.1 - Home Depot, a nationwide home improvement...Ch. 16.1 - Corvette, Ferrari, and Jaguar produced a variety...Ch. 16.1 - The film Suicide Squad has an average rating of...Ch. 16.2 - In a regression analysis involving 27...
Ch. 16.2 - Prob. 11ECh. 16.2 - The Professional Golfers’ Association of America...Ch. 16.2 - Refer to exercise 12.
Develop an estimated...Ch. 16.2 - A 10-year study conducted by the American Heart...Ch. 16.2 - The average monthly residential gas bill for Black...Ch. 16.5 - Prob. 16ECh. 16.5 - Prob. 17ECh. 16.5 - Prob. 18ECh. 16.5 - Prob. 19ECh. 16.5 - Prob. 20ECh. 16.5 - Prob. 21ECh. 16.5 - Prob. 22ECh. 16.5 - Prob. 23ECh. 16.6 - The following data show the daily closing prices...Ch. 16.6 - Refer to the Cravens data set in Table 16.5. In...Ch. 16 - A sample containing years to maturity and yield...Ch. 16 - Consumer Reports tested 19 different brands and...Ch. 16 - A study investigated the relationship between...Ch. 16 - Refer to the data in exercise 28. Consider a model...Ch. 16 - Refer to the data in exercise 28.
Develop an...Ch. 16 - Prob. 31SECh. 16 - The Ladies Professional Golf Association (LPGA)...Ch. 16 - Wine Spectator magazine contains articles and...
Knowledge Booster


Learn more about
Need a deep-dive on the concept behind this application? Look no further. Learn more about this topic, statistics and related others by exploring similar questions and additional content below.Similar questions
- Find the equation of the regression line for the following data set. x 1 2 3 y 0 3 4arrow_forwardLife Expectancy The following table shows the average life expectancy, in years, of a child born in the given year42 Life expectancy 2005 77.6 2007 78.1 2009 78.5 2011 78.7 2013 78.8 a. Find the equation of the regression line, and explain the meaning of its slope. b. Plot the data points and the regression line. c. Explain in practical terms the meaning of the slope of the regression line. d. Based on the trend of the regression line, what do you predict as the life expectancy of a child born in 2019? e. Based on the trend of the regression line, what do you predict as the life expectancy of a child born in 1580?2300arrow_forwardThe ordered pairs below give the median sales prices y (in thousands of dollars) of new homes sold in a neighborhood from 2009 through 2016. (2009, 179.4) (2011, 191.0) (2013, 202.6) (2015, 214.9) (2010, 185.4) (2012, 196.7) (2014, 208.7) (2016, 221.4) A linear model that approximates the data is y=5.96t+125.5,9t16, where t represents the year, with t=9 corresponding to 2009. Plot the actual data and the model on the same graph. How closely does the model represent the data?arrow_forward
- Does Table 1 represent a linear function? If so, finda linear equation that models the data.arrow_forwardDemand for Candy Bars In this problem you will determine a linear demand equation that describes the demand for candy bars in your class. Survey your classmates to determine what price they would be willing to pay for a candy bar. Your survey form might look like the sample to the left. a Make a table of the number of respondents who answered yes at each price level. b Make a scatter plot of your data. c Find and graph the regression line y=mp+b, which gives the number of respondents y who would buy a candy bar if the price were p cents. This is the demand equation. Why is the slope m negative? d What is the p-intercept of the demand equation? What does this intercept tell you about pricing candy bars? Would you buy a candy bar from the vending machine in the hallway if the price is as indicated. Price Yes or No 50 75 1.00 1.25 1.50 1.75 2.00arrow_forward
arrow_back_ios
arrow_forward_ios
Recommended textbooks for you
 Algebra and Trigonometry (MindTap Course List)AlgebraISBN:9781305071742Author:James Stewart, Lothar Redlin, Saleem WatsonPublisher:Cengage Learning
 Glencoe Algebra 1, Student Edition, 9780079039897...AlgebraISBN:9780079039897Author:CarterPublisher:McGraw Hill
 Functions and Change: A Modeling Approach to Coll...AlgebraISBN:9781337111348Author:Bruce Crauder, Benny Evans, Alan NoellPublisher:Cengage Learning
Algebra and Trigonometry (MindTap Course List)
Algebra
ISBN:9781305071742
Author:James Stewart, Lothar Redlin, Saleem Watson
Publisher:Cengage Learning
Glencoe Algebra 1, Student Edition, 9780079039897...
Algebra
ISBN:9780079039897
Author:Carter
Publisher:McGraw Hill
Functions and Change: A Modeling Approach to Coll...
Algebra
ISBN:9781337111348
Author:Bruce Crauder, Benny Evans, Alan Noell
Publisher:Cengage Learning
Correlation Vs Regression: Difference Between them with definition & Comparison Chart; Author: Key Differences;https://www.youtube.com/watch?v=Ou2QGSJVd0U;License: Standard YouTube License, CC-BY
Correlation and Regression: Concepts with Illustrative examples; Author: LEARN & APPLY : Lean and Six Sigma;https://www.youtube.com/watch?v=xTpHD5WLuoA;License: Standard YouTube License, CC-BY