
Concept explainers
Videos
In working further with the problem of exercise 4, statisticians suggested the use of the following curvilinear estimated regression equation.
- a. Use the data of exercise 4 to compute the coefficients of this estimated regression equation.
- b. Using α = .01, test for a significant relationship.
- c. Estimate the traffic flow in vehicles per hour at a speed of 38 miles per hour.
4. A highway department is studying the relationship between traffic flow and speed. The following model has been hypothesized.
where
y = traffic flow in vehicles per hour
x = vehicle speed in miles per hour
The following data were collected during rush hour for six highways leading out of the city.
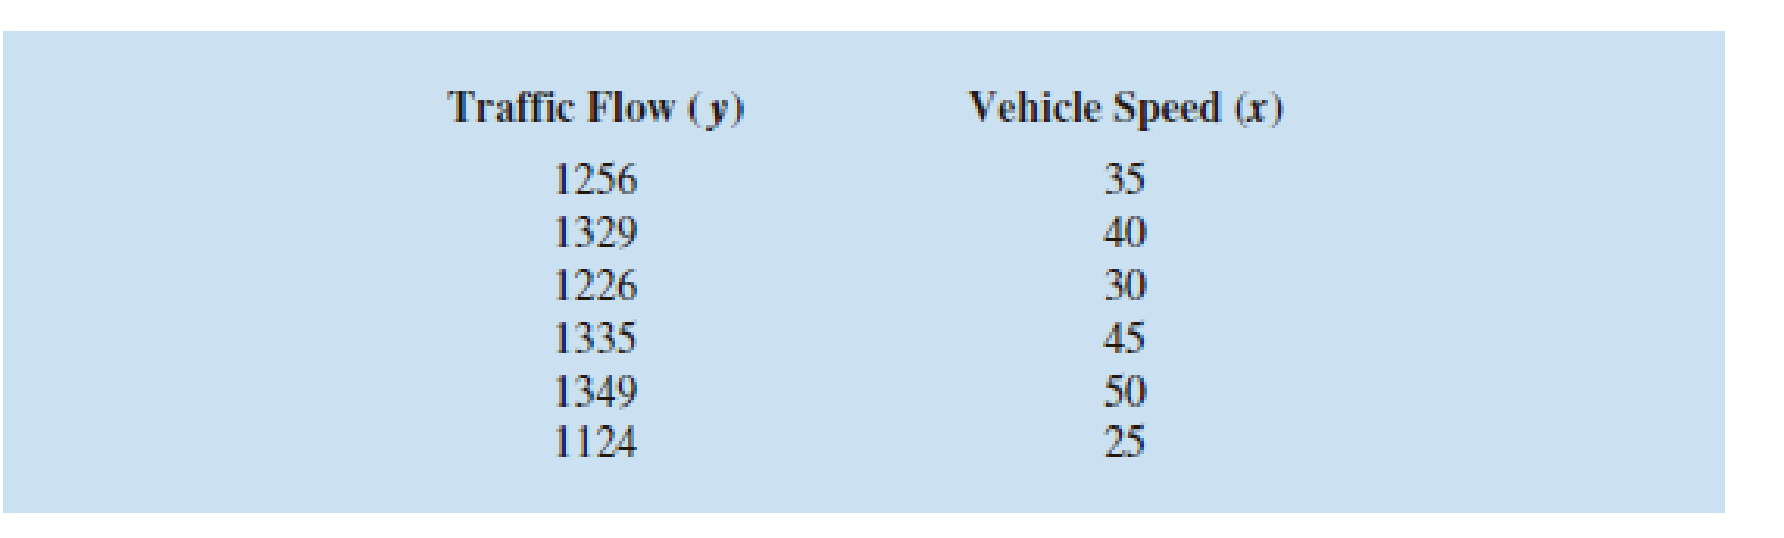
- a. Develop an estimated regression equation for the data.
- b. Using α = .01, test for a significant relationship.
Want to see the full answer?
Check out a sample textbook solution
Chapter 16 Solutions
Modern Business Statistics with Microsoft Office Excel (with XLSTAT Education Edition Printed Access Card) (MindTap Course List)


- 1. Based on the given data, find the estimated regression equation using least square methods.arrow_forwardIt is required to use the data given in the table to estimate the parameters of the multiple linear regression equation by any of the estimation methods:arrow_forwardAccording to World Health Organization (WHO), the recommended limit for a noise level inside a classroom is 35 dBA. However, nine out of ten schools fail to meet this recommendation. A researcher wishes to conduct a study relevant to the prior information, but as a gap, he decides to include the area (in square meters) of every classroom and how it could possibly affect the resulting noise level. He selects 17 classrooms at random, and the noise levels are recorded in the next slide. a. Find the regression equation and construct the scatter plot diagram. b. Predict the noise level if a classroom has an area of 85.97 m2 . c. Calculate the coefficient of determination and interpret the findings. d. Calculate the coefficient of alienation and interpret the findings. Use Excelarrow_forward
- The estimated value of Y calculated from the regression equation is denoted as ____.arrow_forwardA value of r close to _____ indicates that the regression equation is extremely useful for making predictions.arrow_forwardThe owner of Original Italian Pizza restaurant chain wants to understand which variable most strongly influences the sales of his specialty deep-dish pizza. He has gathered data on the monthly sales of deep-dish pizzas at his restaurants and observations on other potentially relevant variables for each of several outlets in central Indiana. These data are provided in the file P10_04.xlsx. Estimate a simple linear regression equation between the quantity sold (Y) and each of the following candidates for the best explanatory variable: average price of deep-dish pizzas (X1), monthly advertising expenditures (X2), and disposable income per household in the areas surrounding the outlets (X3). Round your answers for intercept coefficients to the nearest whole number and slope coefficients to two decimal places, if necessary. If your answer is negative number, enter "minus" sign.arrow_forward
- The table presents data on the taste test of 38 brands of pinot noir wine [data were first reported in an article by Kwan, Kowalski, and Skogenboe in the Journal Agricultural and Food Chemistry (1979, Vol. 27), the response variable is y = quality, and we want to find the "best" regression equation that relates quality to the other five parametersarrow_forward.The worker has noticed that the more time he spends at work (x), the less money he is likely to make (y) in conducting transactions for his firm. Which of the regression equations MOST suggests such a possibility?arrow_forwardA value of r close to 0 indicates that the regression equation is either useless or ______ for making predictions.arrow_forward
- If I want to estimate the regression of a model by using OLS on Eveiws , and I chose the "keep it as general as possible" approach, what tests can I apply through the estimation and inference process to validate the model and the variables?arrow_forwardThe estimated regression equation for a model involving two independent variables and 10 observations follows.arrow_forwardSuppose that researchers are interested in determining the bi-annual salary of statisticians of different levels using their years of experience and their education level (M = bachelors, P = doctorate). They fit the following model to a dataset that includes these variables and, after performing the proper steps of multiple linear regression, the following multiple linear regression model is obtained: yˆ = 42308 + 323x1 + 213x2 + 301(x1*x2) where the variables are as follows: yˆ = predicted bi−annual salary in dollars, x1 = number of years of experiencex2= {1 if the education level is a doctorate 0 if the education level is a bachelors What is the predicted bi-annual salary in dollars of an employee with 5 years of experience and a bachelor’s degree?arrow_forward
 MATLAB: An Introduction with ApplicationsStatisticsISBN:9781119256830Author:Amos GilatPublisher:John Wiley & Sons Inc
 Probability and Statistics for Engineering and th...StatisticsISBN:9781305251809Author:Jay L. DevorePublisher:Cengage Learning
 Statistics for The Behavioral Sciences (MindTap C...StatisticsISBN:9781305504912Author:Frederick J Gravetter, Larry B. WallnauPublisher:Cengage Learning
 Elementary Statistics: Picturing the World (7th E...StatisticsISBN:9780134683416Author:Ron Larson, Betsy FarberPublisher:PEARSON
 The Basic Practice of StatisticsStatisticsISBN:9781319042578Author:David S. Moore, William I. Notz, Michael A. FlignerPublisher:W. H. Freeman
 Introduction to the Practice of StatisticsStatisticsISBN:9781319013387Author:David S. Moore, George P. McCabe, Bruce A. CraigPublisher:W. H. Freeman