
Modern Business Statistics with Microsoft Office Excel (with XLSTAT Education Edition Printed Access Card) (MindTap Course List)
6th Edition
ISBN: 9781337115186
Author: David R. Anderson, Dennis J. Sweeney, Thomas A. Williams, Jeffrey D. Camm, James J. Cochran
Publisher: Cengage Learning
expand_more
expand_more
format_list_bulleted
Concept explainers
Videos
Textbook Question
Chapter 16, Problem 28SE
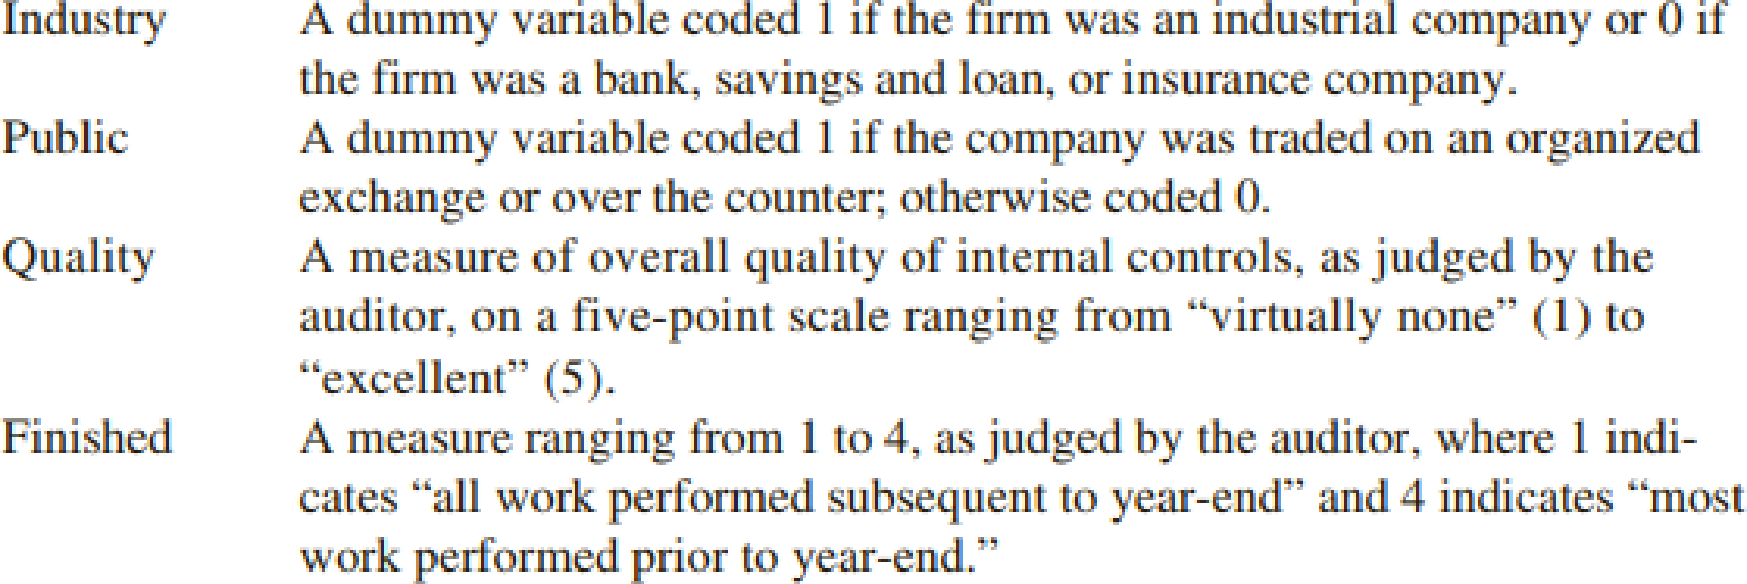
A study investigated the relationship between audit delay (Delay), the length of time from a company’s fiscal year-end to the date of the auditor’s report, and variables that describe the client and the auditor. Some of the independent variables that were included in this study follow.
A sample of 40 companies provided the following data.
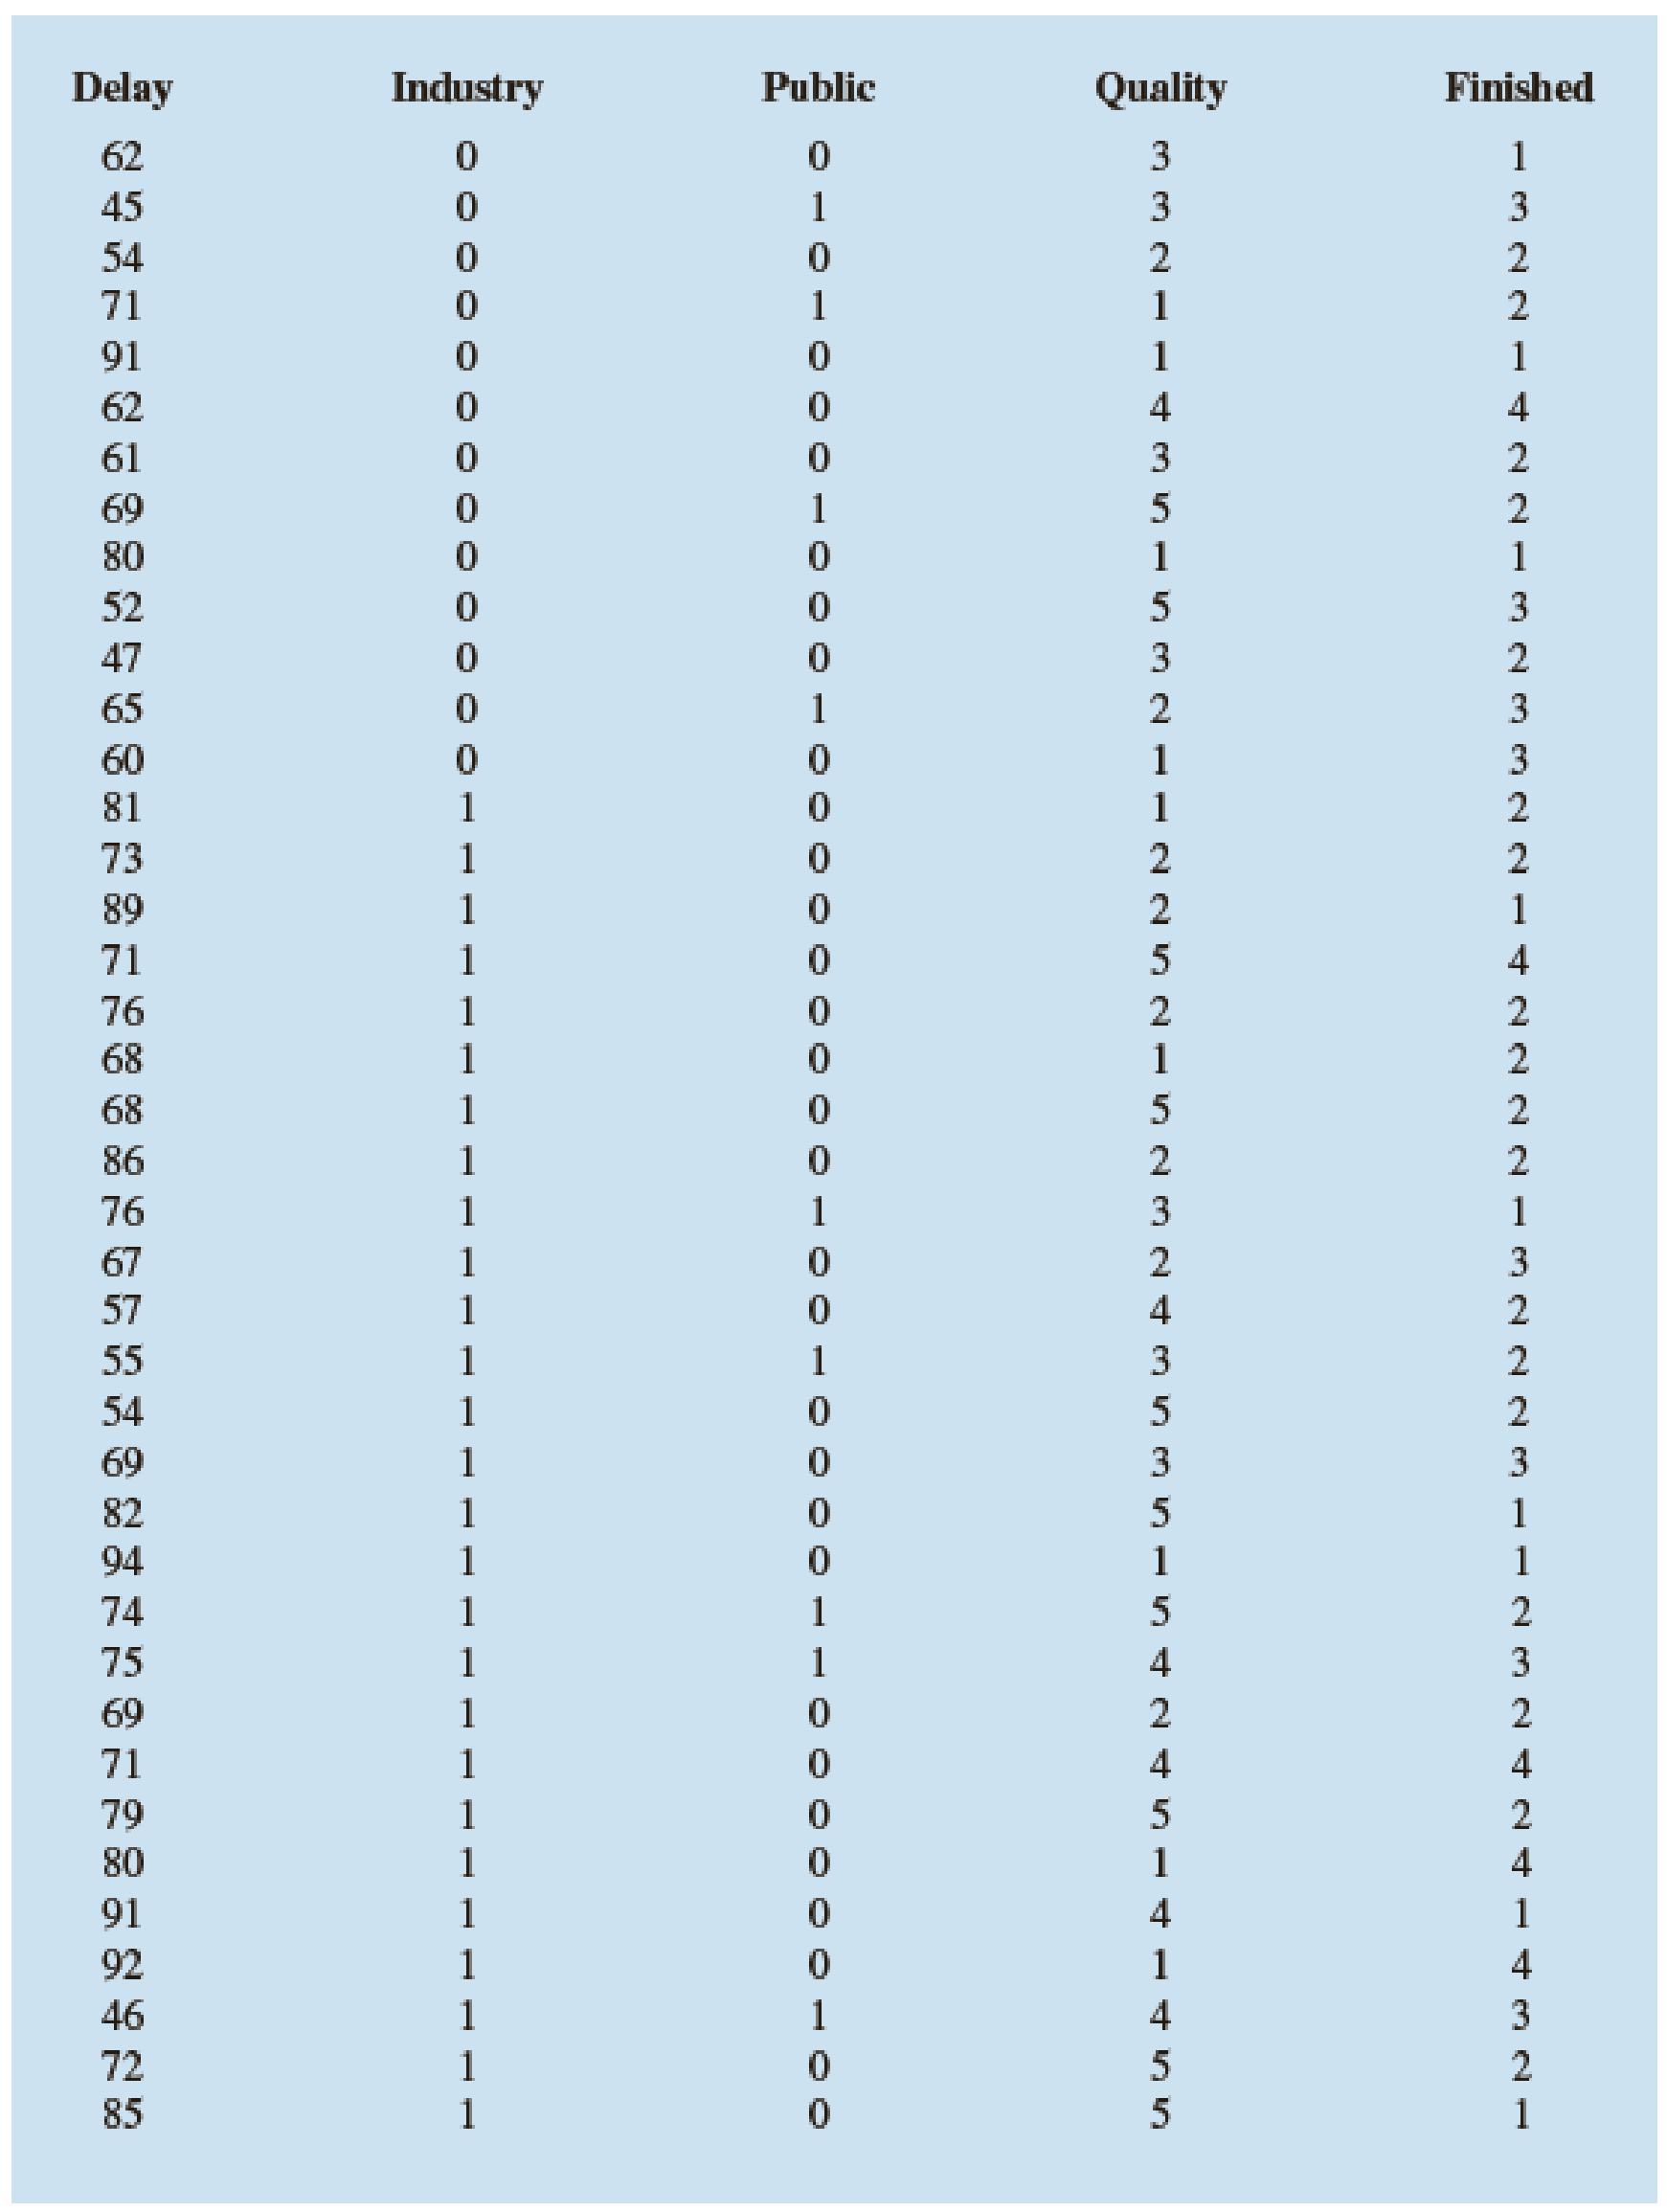
- a. Develop the estimated regression equation using all of the independent variables.
- b. Did the estimated regression equation developed in part (a) provide a good fit? Explain.
- c. Develop a
scatter diagram showing Delay as afunction of Finished. What does this scatter diagram indicate about the relationship between Delay and Finished? - d. On the basis of your observations about the relationship between Delay and Finished, develop an alternative estimated regression equation to the one developed in (a) to explain as much of the variability in Delay as possible.
Expert Solution & Answer

Trending nowThis is a popular solution!

Students have asked these similar questions
Do students with higher college grade point averages (GPAs) earn more than those graduates with lower GPAs?† Consider the following hypothetical college GPA and salary data (10 years after graduation).
GPA
Salary ($)
2.22
72,000
2.29
48,000
2.57
72,000
2.59
64,000
2.77
88,000
2.85
98,000
3.12
133,000
3.35
130,000
3.66
157,000
3.68
162,000
Use these data to develop an estimated regression equation that can be used to predict annual salary 10 years after graduation given college GPA. (Let x = GPA, and let y = salary (in $). Round your numerical values to the nearest integer.)
ŷ =
Find the value of the test statistic. (Round your answer to two decimal places.)
=
Find the p-value. (Round your answer to three decimal places.)
p-value =
Jensen Tire & Auto is deciding whether to purchase a maintenance contract for its newcomputer wheel alignment and balancing machine. Managers feel that maintenance expenseshould be related to usage, and they collected the following information on weeklyusage (hours) and annual maintenance expense (in hundreds of dollars).
a. Develop a scatter chart with weekly usage hours as the independent variable. Whatdoes the scatter chart indicate about the relationship between weekly usage and annualmaintenance expense?b. Use the data to develop an estimated regression equation that could be used to predictthe annual maintenance expense for a given number of hours of weekly usage. Whatis the estimated regression model?
c. Test whether each of the regression parameters b0 and b1 is equal to zero at a 0.05level of significance. What are the correct interpretations of the estimated regressionparameters? Are these interpretations reasonable?d. How much of the variation in the sample values of…
A psychological study aimed at predicting Al Ain secondary school students’ mental health scores via their scores in the life satisfaction scale. The researcher examines the following null hypothesis: there is no significant relationship between Al Ain secondary school students’ mental health and their life satisfaction scores at 0.05 level of significance.
Use the following data to establish the required regression equation.
Student #
Mental health score out of 50
Life- satisfaction score out of 100
1
40
80
2
41
87
3
34
90
4
30
78
5
44
89
6
42
85
7
45
88
8
32
77
9
47
90
10
22
57
11
30
78
12
28
77
13
35
76
14
40
84
15
31
76
16
39
80
17
41
84
18
24
60
19
22
50
20
37
75
21
40
80
22
38
78
23
29
60
24
24
55
25
24
62
26
29
61
27
32
65
28
34
66
29
28
67…
Chapter 16 Solutions
Modern Business Statistics with Microsoft Office Excel (with XLSTAT Education Edition Printed Access Card) (MindTap Course List)
Ch. 16.1 - Consider the following data for two variables, x...Ch. 16.1 - Consider the following data for two variables, x...Ch. 16.1 - Prob. 3ECh. 16.1 - A highway department is studying the relationship...Ch. 16.1 - In working further with the problem of exercise 4,...Ch. 16.1 - A study of emergency service facilities...Ch. 16.1 - Home Depot, a nationwide home improvement...Ch. 16.1 - Corvette, Ferrari, and Jaguar produced a variety...Ch. 16.1 - The film Suicide Squad has an average rating of...Ch. 16.2 - In a regression analysis involving 27...
Ch. 16.2 - Prob. 11ECh. 16.2 - The Professional Golfers’ Association of America...Ch. 16.2 - Refer to exercise 12.
Develop an estimated...Ch. 16.2 - A 10-year study conducted by the American Heart...Ch. 16.2 - The average monthly residential gas bill for Black...Ch. 16.5 - Prob. 16ECh. 16.5 - Prob. 17ECh. 16.5 - Prob. 18ECh. 16.5 - Prob. 19ECh. 16.5 - Prob. 20ECh. 16.5 - Prob. 21ECh. 16.5 - Prob. 22ECh. 16.5 - Prob. 23ECh. 16.6 - The following data show the daily closing prices...Ch. 16.6 - Refer to the Cravens data set in Table 16.5. In...Ch. 16 - A sample containing years to maturity and yield...Ch. 16 - Consumer Reports tested 19 different brands and...Ch. 16 - A study investigated the relationship between...Ch. 16 - Refer to the data in exercise 28. Consider a model...Ch. 16 - Refer to the data in exercise 28.
Develop an...Ch. 16 - Prob. 31SECh. 16 - The Ladies Professional Golf Association (LPGA)...Ch. 16 - Wine Spectator magazine contains articles and...
Knowledge Booster


Learn more about
Need a deep-dive on the concept behind this application? Look no further. Learn more about this topic, statistics and related others by exploring similar questions and additional content below.Similar questions
- Olympic Pole Vault The graph in Figure 7 indicates that in recent years the winning Olympic men’s pole vault height has fallen below the value predicted by the regression line in Example 2. This might have occurred because when the pole vault was a new event there was much room for improvement in vaulters’ performances, whereas now even the best training can produce only incremental advances. Let’s see whether concentrating on more recent results gives a better predictor of future records. (a) Use the data in Table 2 (page 176) to complete the table of winning pole vault heights shown in the margin. (Note that we are using x=0 to correspond to the year 1972, where this restricted data set begins.) (b) Find the regression line for the data in part ‚(a). (c) Plot the data and the regression line on the same axes. Does the regression line seem to provide a good model for the data? (d) What does the regression line predict as the winning pole vault height for the 2012 Olympics? Compare this predicted value to the actual 2012 winning height of 5.97 m, as described on page 177. Has this new regression line provided a better prediction than the line in Example 2?arrow_forwardThe operations manager of a musical instrument distributor feels that the demand for Bass Drums may be related to the number of television appearances by the popular rick group Green Shades during the previous month. The manager has collected the data shown in the following table. Demand for Bass Drums 3 6 7 5 10 8 Green Shades TV appearances 3 4 7 6 8 5 Develop the linear regression equation to forecast. Forecast demand for Bass Drums when Green Shades’ TV appearances are 10. Compute MSE and standard deviation for Problem 8.arrow_forwardIn the packaging department of a large aircraft parts distributor, a fairly reliable estimate of packaging and processing costs can be determined by knowing the weight of an order. Thus, the weight is a cost driver that accounts for a sizable fraction of the packaging and processing costs at this company. Data for the past 10 orders are given as follows. Solve, a. Estimate the b0 and b1 coefficients, and determine the linear regression equation to fit these data. b. What is the correlation coefficient (R)? c. If an order weighs 250 lb, how much should it cost to package and process it?arrow_forward
- A mail-order business selling personal computer supplies, software and hardware maintains a centralized warehouse. Management is currently examining the process of distribution from the warehouse and wants to study the factors that affect the warehouse distribution costs. Data collected over 24 random months contain the warehouse’s distribution cost (in thousands of Rands), the sales (in thousands of Rands) and the number of orders received. A multiple linear regression model was fitted to the data by using Stat1.2. Use the output to answer the questions that follow by typing only the letter of the correct option in the answer boxes. Variablesy: Warehouse Distribution Costx1: Salesx2: Number of Orders Model Fitting StatisticsR2 = 0.8504Adj R2: ? Regression Coefficients Beta Parameter Standard b Parameter Standard Estimates…arrow_forwardQUESTION 2 XXX Electric Illuminating Company is doing a survey on the relationship between electricity used in kilowatt-hours (thousand) and the number of rooms in a private single-family residence. A random sample of 10 homes was selected and the electricity consumption recorded as below. ii. Find a suitable linear regression equation ? = ? + ??. iii. Determine the number of kilowatt-hours (thousand) for an eleven-room residence.arrow_forwardIn a multiple regression analysis with three independent variables (X1, X2, and X3), what is the general form of the regression equation used to model the relationship between the dependent variable (Y) and the independent variables (X1, X2, and X3)?arrow_forward
- Suppose the Sherwin-Williams Company is interested in developing a simple regression model with paint sales (Y) as the dependent variable and selling price (P) as the independent variable. Complete the following worksheet and then use it to determine the estimated regression line. Sales Region Selling Price Sales ($/Gallon) (x 1000 Gal) ii xixi yiyi xixiyiyi xi2xi2 yi2yi2 1 15 160 2,400 225 25,600 2 13.5 220 2,970 182.25 48,400 3 16.5 140 2,310 272.25 19,600 4 14.5 190 2,755 210.25 36,100 5 17 120 2,040 289 14,400 6 16 160 2,560 256 25,600 7 13 210 2,730 169 44,100 8 18 150 2,700 324 22,500 9 12 220 2,640 144 48,400 10 15.5 190 2,945 240.25 36,100 Total 151 1,760 26,050 2,312 320,800 Regression Parameters Estimations Slope (ββ) -16.49 Intercept (αα) 424.98 In words, for a dollar increase in the selling price, the expected sales will increase by 2,640 gallons in a given sales region.…arrow_forwardSuppose the Sherwin-Williams Company is interested in developing a simple regression model with paint sales (Y) as the dependent variable and selling price (P) as the independent variable. Complete the following worksheet and then use it to determine the estimated regression line. Sales Region Selling Price Sales ($/Gallon) (x 1000 Gal) ii xixi yiyi xixiyiyi xi2xi2 yi2yi2 1 15 160 2,400 225 25,600 2 13.5 220 2,970 182.25 48,400 3 16.5 140 2,310 272.25 19,600 4 14.5 190 2,755 210.25 36,100 5 17 120 2,040 289 14,400 6 16 160 2,560 256 25,600 7 13 210 2,730 169 44,100 8 18 150 2,700 324 22,500 9 12 210 2,520 144 44,100 10 15.5 190 2,945 240.25 36,100 Total 151 1,750 2,312 What is the estimate of the standard deviation of the estimated slope (sbsb)? 2.627 3.173 2.877 Can you reject the hypothesis (at the 0.05 level of significance) that there is no relationship (i.e., β=0β=0) between the…arrow_forwardGiven the equation of a regression line is y= -1.5x-1.8, what is the best predicted value for y given x= -3.0? Assume that the variables x and y have significant correlation.arrow_forward
- According to "Reproductive Biology of the Aquatic Salamander Amphiuma tridactylum in Louisiana,"† the size of a female salamander's snout is correlated with the number of eggs in her clutch. The following data are consistent with summary quantities reported in the article. Partial Minitab output is also included. Snout-Vent Length Clutch Size 32 45 53 215 53 160 53 170 54 190 57 200 57 270 58 175 58 245 59 215 63 170 63 240 64 245 67 280 The regression equation is Y = -133 + 5.92x Predictor Coef Stdev T P Constant -133.02 64.30 2.07 0.0608 x 5.919 1.127 5.25 0.0002 s = 33.90 R-sq = 69.7% R-sq(adj) = 67.2% Additional summary statistics are given below. n = 14 x = 56.5 y = 201.4 Σx2 = 45,597 Σy2 = 613,550 Σxy = 164,690 You can use the Distribution Calculators page in SALT to find critical values and/or p-values to answer parts of this question. (a) What is the equation of the regression line…arrow_forward(a) For United States, provide data for the variables below over the years 1993 –2007:(i) Net migration rate (per 1,000 population)(ii) Total fertility rate (live births per woman)(iii)Unemployment, general level (Thousands)(iv) Wages(v) Life expectancy at birth for both sexes combined (years)Data can be obtained from the UN database http://data.un.org/Explorer.aspxUsing R-Studio, estimate a regression equation to determine the effect of unemployment,general level, wages and life expectancy at birth for both sexes on the net migration rate.(All codes and regression output should be provided).(i) Write down the regression equation. (ii) Interpret the coefficients and determine which of the individual coefficients in theregression model are statistically significant. In responding, construct and test anyappropriate hypothesis. (iii) Interpret the coefficient of determination.arrow_forwarda) For United States, provide data for the variables below over the years 1993 – 2007: (i) Net migration rate (per 1,000 population) (ii) Total fertility rate (live births per woman) (iii)Unemployment, general level (Thousands) (iv) Wages (v) Life expectancy at birth for both sexes combined (years) Data can be obtained from the UN database http://data.un.org/Explorer.aspx Using R-Studio, estimate a regression equation to determine the effect of unemployment, general level, wages and life expectancy at birth for both sexes on the net migration rate. (All codes and regression output should be provided).(i) Write down the regression equation. (ii) Interpret the coefficients and determine which of the individual coefficients in theregression model are statistically significant. In responding, construct and test anyappropriate hypothesis. (iii) Interpret the coefficient of determination. (iv) Using the 10% level of significance, determine and discuss whether the overallregression equation…arrow_forward
arrow_back_ios
arrow_forward_ios
Recommended textbooks for you
 College AlgebraAlgebraISBN:9781305115545Author:James Stewart, Lothar Redlin, Saleem WatsonPublisher:Cengage Learning
College Algebra
Algebra
ISBN:9781305115545
Author:James Stewart, Lothar Redlin, Saleem Watson
Publisher:Cengage Learning
Correlation Vs Regression: Difference Between them with definition & Comparison Chart; Author: Key Differences;https://www.youtube.com/watch?v=Ou2QGSJVd0U;License: Standard YouTube License, CC-BY
Correlation and Regression: Concepts with Illustrative examples; Author: LEARN & APPLY : Lean and Six Sigma;https://www.youtube.com/watch?v=xTpHD5WLuoA;License: Standard YouTube License, CC-BY