
Modern Business Statistics with Microsoft Office Excel (with XLSTAT Education Edition Printed Access Card) (MindTap Course List)
6th Edition
ISBN: 9781337115186
Author: David R. Anderson, Dennis J. Sweeney, Thomas A. Williams, Jeffrey D. Camm, James J. Cochran
Publisher: Cengage Learning
expand_more
expand_more
format_list_bulleted
Concept explainers
Videos
Textbook Question
Chapter 16.1, Problem 4E
A highway department is studying the relationship between traffic flow and speed. The following model has been hypothesized.
where
y = traffic flow in vehicles per hour
x = vehicle speed in miles per hour
The following data were collected during rush hour for six highways leading out of the city.
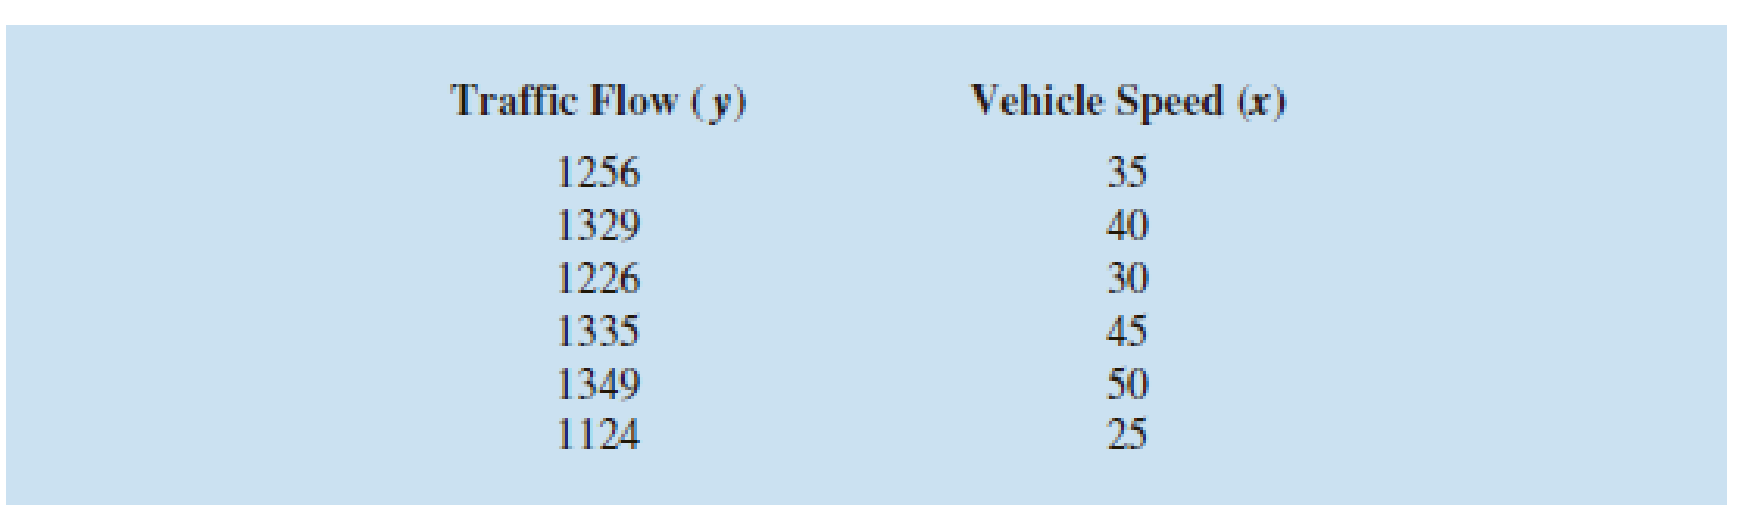
a. Develop an estimated regression equation for the data.
b. Using α = .01, test for a significant relationship.
Expert Solution & Answer

Trending nowThis is a popular solution!

Students have asked these similar questions
Consider the following data for two variables, x and y.
x
9
32
18
15
26
y
9
19
20
15
22
Develop an estimated regression equation for the data of the form
ŷ = b0 + b1x + b2x2.
(Round b0 to two decimal places and b1 to three decimal places and b2 to four decimal places.)
ŷ =
(c)
Use the model from part (b) to predict the value of y when
x = 20.
(Round your answer to two decimal places.)
Given are five observations for two variables, x and y.
xi
1
2
3
4
5
yi
4
6
6
11
13
Develop the estimated regression equation by computing the values of
b0
and
b1
using
b1 =
Σ(xi − x)(yi − y)
Σ(xi − x)2
and
b0 = y − b1x.
ŷ =
(e)
Use the estimated regression equation to predict the value of y when
x = 2.
The director of marketing at Vanguard Corporation believes that sales of the company's Bright Side laundry detergent (S) are related to Vanguard's own advertising expenditure (A), as well as the combined advertising expenditures of its three biggest rival detergent (R). The marketing director collects 36 weekly observations on S, A and R to estimate the following multiple regression equation:
S = a + bA + cR .where, S, A, and R are measured in dollars per week. Vanguard's marketing director is comfortable using parameter estimates that are statistically significant at the 10% level or better.DEPENDENT VARIABLE: S R-SQUARE F-RATIO P-VALUE ON FOBSERVATIONS: 36 0.2247 4.781 0.0150VARIABLE PARAMETER STANDARD T-RATIO P-VALUE ESTIMATE ERRORINTERCEPT 175086.0 63821.0 2.74 0.0098A 0.8550 0.3250…
Chapter 16 Solutions
Modern Business Statistics with Microsoft Office Excel (with XLSTAT Education Edition Printed Access Card) (MindTap Course List)
Ch. 16.1 - Consider the following data for two variables, x...Ch. 16.1 - Consider the following data for two variables, x...Ch. 16.1 - Prob. 3ECh. 16.1 - A highway department is studying the relationship...Ch. 16.1 - In working further with the problem of exercise 4,...Ch. 16.1 - A study of emergency service facilities...Ch. 16.1 - Home Depot, a nationwide home improvement...Ch. 16.1 - Corvette, Ferrari, and Jaguar produced a variety...Ch. 16.1 - The film Suicide Squad has an average rating of...Ch. 16.2 - In a regression analysis involving 27...
Ch. 16.2 - Prob. 11ECh. 16.2 - The Professional Golfers’ Association of America...Ch. 16.2 - Refer to exercise 12.
Develop an estimated...Ch. 16.2 - A 10-year study conducted by the American Heart...Ch. 16.2 - The average monthly residential gas bill for Black...Ch. 16.5 - Prob. 16ECh. 16.5 - Prob. 17ECh. 16.5 - Prob. 18ECh. 16.5 - Prob. 19ECh. 16.5 - Prob. 20ECh. 16.5 - Prob. 21ECh. 16.5 - Prob. 22ECh. 16.5 - Prob. 23ECh. 16.6 - The following data show the daily closing prices...Ch. 16.6 - Refer to the Cravens data set in Table 16.5. In...Ch. 16 - A sample containing years to maturity and yield...Ch. 16 - Consumer Reports tested 19 different brands and...Ch. 16 - A study investigated the relationship between...Ch. 16 - Refer to the data in exercise 28. Consider a model...Ch. 16 - Refer to the data in exercise 28.
Develop an...Ch. 16 - Prob. 31SECh. 16 - The Ladies Professional Golf Association (LPGA)...Ch. 16 - Wine Spectator magazine contains articles and...
Knowledge Booster


Learn more about
Need a deep-dive on the concept behind this application? Look no further. Learn more about this topic, statistics and related others by exploring similar questions and additional content below.Similar questions
- The following fictitious table shows kryptonite price, in dollar per gram, t years after 2006. t= Years since 2006 0 1 2 3 4 5 6 7 8 9 10 K= Price 56 51 50 55 58 52 45 43 44 48 51 Make a quartic model of these data. Round the regression parameters to two decimal places.arrow_forwardConsider the following data for two variables, x and y x 9 32 18 15 26 y 9 20 22 17 23 A. Develop an estimated regression equation for the data of the form ŷ = b0 + b1x. (Round b0 to two decimal places and b1 to three decimal places.) B. Develop an estimated regression equation for the data of the form ŷ = b0 + b1x + b2x2. (Round b0 to two decimal places and b1 to three decimal places and b2 to four decimal places.) C. Use the model from part (b) to predict the value of y when x = 20. (Round your answer to two decimal places.) Please be as detailed as possible in the solution so i may follow along. Thank you for the help!arrow_forwardThe following table displays the mathematics test scores for a random sample of college students, along with their final SY16C grades. a. Fit the regression line y = a+bx to the data and interpret the results. b. Use the regression equation to determine the SY16C grade for a college student who scored60 on their achievement test. What would their SY16C grade be?arrow_forward
- Given are five observations collected in a regression study on two variables. xi 2 6 9 13 20 yi 7 18 9 26 23 Develop the estimated regression equation for these data. ŷ = (c) Use the estimated regression equation to predict the value of y when x = 20.arrow_forwardThe director of marketing at Vanguard Corporation believes that sales of the company's Bright Side laundry detergent (S) are related to Vanguard's own advertising expenditure (A), as well as the combined advertising expenditures of its three biggest rival detergents (R). The marketing director collects 36 weekly observations on S, A, and R to estimate the following multiple regression equation: S = a + bA + cR where S, A, and R are measured in dollars per week. Vanguard's marketing director is comfortable using parameter estimates that are statistically significant at the 10 percent level or better. a. What sign does the marketing director expect a, b, and c to have? b. Interpret the coefficeints a, b, and c. The regression output from the computer is as follows: c. Does Vanguard's advertising expenditure have a statistically significant effect on the sales of Bright Side detergent? Explain, using the appropriate…arrow_forwardThe director of marketing at Vanguard Corporation believes that sales of the company’s Bright Side laundry detergent (S) are related to Vanguard’s own advertising expenditure (A), as well as the combined advertising expenditures of its three biggest rival detergents (R). The marketing director collects 36 weekly observations on S, A, and R to estimate the following multiple regression equation: S = a + bA + cR. where S, A, and R are measured in dollars per week. Vanguard’s marketing director is comfortable using parameter estimates that are statistically significant at the 10 percent level or better. What sign does the marketing director expect a, b, and c to have? Interpret the coefficients a, b, and c. The regression output from the computer is as follows: 3- Does Vanguard’s advertising expenditure have a statistically significant effect on the sales of Bright Side detergent? Explain, using the appropriate p-value. 4- Does advertising by its three largest rivals affect sales of…arrow_forward
- The director of marketing at Vanguard Corporation believes that sales of the company's Bright Side laundry detergent (S) are related to Vanguard's own advertising expenditure (A), as well as the combined advertising expenditures of its three biggest rival detergents (R). The marketing director collects 36 weekly observations on S, A, and R to estimate the following multiple regression equation: S = a + bA + cR where S, A, and R are measured in dollars per week. Vanguard's marketing director is comfortable using parameter estimates that are statistically significant at the 10 percent level or better. a. What sign does the marketing director expect a, b, and c to have? b. Interpret the coefficeints a, b, and c. The regression output from the computer is as follows: c. Does Vanguard's advertising expenditure have a statistically significant effect on the sales of Bright Side detergent? Explain, using the appropriate…arrow_forwardThe birth lengths in cm (x) and birth weights in kg (y) of a sample of 50 newborn female babies are compared, yielding a correlation coefficient of r=0.578 and a linear regression equation of ŷ =−8.89+0.243x The babies all had lengths between 46.5 and 53.0 cm, and weights between 2.50 and 4.05 kg. Based on this, predict the birth weight of a newborn female baby with a birth length of 48.5 cm.arrow_forwardA study was done that examined the effectiveness of a 7-Minute Screen test for Alzheimer’s disease. The study evaluated the relationship between scores from the 7-Minute Screen and scores for the same patients from a set of cognitive exams that are typically used to test for Alzheimer’s disease. For a sample of n=9 patients, the scores for the 7-Minute Screen averaged M=7 with SS = 92. The cognitive test scores averaged M=17 with SS = 236. For these data, SP = 127. Find the regression equation for predicting the cognitive scores from the 7-Minute Screen score. b = a = Regression equation = What percentage of variance in the cognitive scores is accounted for by the regression equation? r = r2 = Does the regression equation account for a significant portion of te variance in the cognitive scores? Use α = .05 to evaluate the F ratio. MSregression = MSresidual = Fcalculated = Fcritical = Decision =arrow_forward
- Given are five observations collected in a regression study on two variables. xi 2 6 9 13 20 yi 7 18 9 26 23 Compute b0 and b1 (to 1 decimal).b1 b0 Complete the estimated regression equation (to 1 decimal).^y = + x Use the estimated regression equation to predict the value of y when x = 6 (to 1 decimal).^y =arrow_forwardA researcher conducted a number of descriptive statistics for two variables X and Y. They were as follows: SP = -20; SSx = 4; My = 7; Mx = 3 What is b equal to? What is a equal to? Using b and a construct a regression equation, and then using the regression equation, calculate the value of predicted Y when X = 2?arrow_forwardThe admissions officer for a certain college developed the following estimated regression equation relating the final college GPA to the student's SAT mathematics score and high school GPA. ŷ = −1.39 + 0.0234x1 + 0.00482x2 where x1 = high-school grade point average x2 = SAT mathematics score y = final college grade point average. #1)A high-school average 84 corresponds to x1 = 84 and a score of 535 on the SAT mathematics test corresponds to x2 = 535. Substitute these values into the estimated regression equation to find the final college GPA, rounding the result to two decimal places. GPA = −1.39 + 0.0234x1 + 0.00482x2 = -1.39 +0.0234 (_____________) + 0.00482 (535) = __________________arrow_forward
arrow_back_ios
SEE MORE QUESTIONS
arrow_forward_ios
Recommended textbooks for you
 Functions and Change: A Modeling Approach to Coll...AlgebraISBN:9781337111348Author:Bruce Crauder, Benny Evans, Alan NoellPublisher:Cengage Learning
Functions and Change: A Modeling Approach to Coll...
Algebra
ISBN:9781337111348
Author:Bruce Crauder, Benny Evans, Alan Noell
Publisher:Cengage Learning
Correlation Vs Regression: Difference Between them with definition & Comparison Chart; Author: Key Differences;https://www.youtube.com/watch?v=Ou2QGSJVd0U;License: Standard YouTube License, CC-BY
Correlation and Regression: Concepts with Illustrative examples; Author: LEARN & APPLY : Lean and Six Sigma;https://www.youtube.com/watch?v=xTpHD5WLuoA;License: Standard YouTube License, CC-BY