
STATISTICAL TECHNIQUES-ACCESS ONLY
16th Edition
ISBN: 9780077639648
Author: Lind
Publisher: MCG
expand_more
expand_more
format_list_bulleted
Concept explainers
Videos
Textbook Question
Chapter 18, Problem 2.2PT
Listed below are the price and quantity of several golf items purchased by members of the men’s golf league at Indigo Creek Golf and Tennis Club for 2009 and 2013.
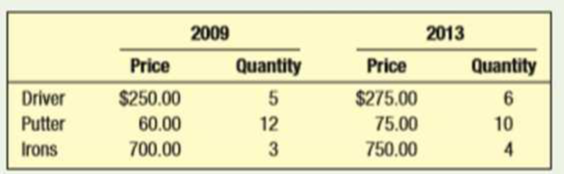
- a. Determine the simple aggregate price index, with 2009 as the base period.
- b. Determine a Laspeyres price index.
- c. Determine the Paasche price index.
- d. Determine a value index.
Expert Solution & Answer

Trending nowThis is a popular solution!

Students have asked these similar questions
Use the following price information for selected items for 2010 and 2018. Production figures for those two periods are also given.
Compute a simple price index for each of the four items. Use 2010 as the base period. (Round your answers to 1 decimal place.)
Use the following price information for selected foods for 2000 and 2013 given in the following table in the image.
a. Compute a simple price index for each of the four items. Use 2000 as the base period.
b. Compute a simple aggregate price index. Use 2000 as the base period.
c.Compute Laspeyres’ price index for 2013 using 2000 as the base period.
Use the following price information for selected items for 2010 and 2018. Production figures for those two periods are also given.
Chapter 18 Solutions
STATISTICAL TECHNIQUES-ACCESS ONLY
Ch. 18 - Prob. 1SRCh. 18 - Calculate a four-quarter weighted moving average...Ch. 18 - Prob. 2ECh. 18 - Prob. 2SRCh. 18 - Prob. 3ECh. 18 - Prob. 4ECh. 18 - Prob. 5ECh. 18 - Prob. 6ECh. 18 - Sales at Tomlin Manufacturing from 2009 to 2013...Ch. 18 - Prob. 7E
Ch. 18 - Prob. 8ECh. 18 - Prob. 4SRCh. 18 - Prob. 9ECh. 18 - Prob. 10ECh. 18 - Prob. 5SRCh. 18 - Prob. 11ECh. 18 - Prob. 12ECh. 18 - Refer to Exercise 9 regarding the absences at...Ch. 18 - Prob. 14ECh. 18 - Prob. 15ECh. 18 - Prob. 16ECh. 18 - Prob. 17CECh. 18 - Prob. 18CECh. 18 - Prob. 19CECh. 18 - Prob. 20CECh. 18 - Prob. 21CECh. 18 - Prob. 22CECh. 18 - Prob. 23CECh. 18 - Prob. 24CECh. 18 - Prob. 25CECh. 18 - Prob. 26CECh. 18 - Prob. 27CECh. 18 - The quarterly production of pine lumber, in...Ch. 18 - Prob. 29CECh. 18 - Sales of roof material, by quarter, for 2007...Ch. 18 - Blueberry Farms Golf and Fish Club of Hilton Head,...Ch. 18 - Prob. 32CECh. 18 - Ray Anderson, owner of Anderson Ski Lodge in...Ch. 18 - Prob. 34CECh. 18 - Prob. 35CECh. 18 - Prob. 36CECh. 18 - Consider the variable mean amount per transaction...Ch. 18 - Prob. 38CECh. 18 - Prob. 39DECh. 18 - Prob. 1PCh. 18 - Prob. 2PCh. 18 - Prob. 3PCh. 18 - Prob. 1.1PTCh. 18 - Prob. 1.2PTCh. 18 - Prob. 1.3PTCh. 18 - Prob. 1.4PTCh. 18 - Prob. 1.5PTCh. 18 - Prob. 1.6PTCh. 18 - Prob. 1.7PTCh. 18 - Prob. 1.8PTCh. 18 - Prob. 1.9PTCh. 18 - Prob. 1.10PTCh. 18 - Prob. 2.1PTCh. 18 - Listed below are the price and quantity of several...Ch. 18 - Prob. 2.3PT
Knowledge Booster


Learn more about
Need a deep-dive on the concept behind this application? Look no further. Learn more about this topic, statistics and related others by exploring similar questions and additional content below.Similar questions
- A price relative was computed for houses. The base period is 2005. The price relative in 2010 was 130. The interpretation of the price relative is that a. there has been a 130% increase in the price of houses from 2005 to 2010. b. there has been a 30% increase in the price of houses from 2005 to 2010. c. the price of houses in 2010 was $130 higher than the price in 2005. d. It is impossible to interpret the index.arrow_forwardPlease assist with Selling Price and Age on Part A.arrow_forwardPlease solve this questionarrow_forward
- In 2014, the median salary nationwide for a high school teacher was $56,310 per year. The median annual wage for all workers was $35,540.SOURCE: United States. Department of Labor. "High School Teachers." Occupational Outlook Handbook. 17 Dec. 2015. Web. 7 March 2016. Suppose a worker makes $29,000 in wages per year. Find the percent increase in salary the worker can expect if he/she trains to be a teacher and can expect to earn a salary of $40,000. Enter your response to the nearest 0.1% %arrow_forwardWhat is the selling price of a $10 item after a 50% markup?arrow_forwardA public utility intends to buy a turbine as part of an expansion plan and must now decide on thenumber of spare parts to order. One part, no. X135, can be purchased for $100 each. Carrying anddisposal costs are estimated to be 145 percent of the purchase price over the life of the turbine. Astockout would cost roughly $88,000 due to downtime, ordering, and “special purchase” factors.Historical records based on the performance of similar equipment operating under similar conditions suggest that demand for spare parts will tend to approximate a Poisson distribution with amean of 3.2 parts for the useful life of the turbine.a. What is the optimal number of spares to order?b. Carrying no spare parts would be the best strategy for what range of shortage cost?arrow_forward
- This question has 2 parts.arrow_forwardComplete the following table by finding the net price factor, single equivalent discount, trade discount (in dollars), and net price (in dollars). Round the net price factor and single equivalent discount to five decimal places, and the trade discount and net price to the nearest cent, when necessary. List Price $430.70 Trade Discount Rate 31/15/5 Net Price Factor Single Equivalent Discount tA Trade Discount tA Net Pricearrow_forwardUse the average annual consumer price index table to convert the 1978 minimum wage from actual dollars to 1996 dollars. Is the result consistent with the entry in the accompanying minimum wage table? Click the icon to view the table of federal minimum wages. The 1978 minimum wage in 1996 dollars is $. (Round to the nearest cent as needed.) Federal Minimum Wages Year 1938 1939 1945 1950 1990 1956 1961 1967 1968 pe 1974 1976 1978 1979 1981 1990 1991 1996 1997 2007 2008 2009 Actual Dollars 1996 Dollars $2.78 $3.39 $3.49 $0.25 $0.30 $0.40 $0.75 90.19 $1.00 $1.25 $1.40 91.00 $1.60 $2.00 22:00 $2.30 $2.50 $2.65 22.0 $2.90 222 $3.35 $3.50 $4.25 $4.75 $5.15 $5.85 $6.55 $7.25 $4.88 67.90 $5.77 $6.41 20.70 $6.58 $7.21 66.27 $6.37 20:37 $6.34 20:20 $6.38 20:30 $6.27 90:20 $5.78 $4.56 $4.90 $4.75 $5.03 $4.42 $4.77 $5.12 - X Average Annual Consumer Price Index (CPI) (1982-1984 = 100) Year CPI Year CPI Year CPI 1976 56.9 1989 124.0 2001 177.1 1977 60.6 1990 130.7 2002 179.9 1978 65.2 1991 136.2 2003…arrow_forward
- Suppose you have the following bar graph showing foreclosure rates for a few select states. If you want to make the point that the rates are all very similar, how would you change the graph? Choose the correct answer below. OA. To deemphasize the differences in foreclosure rates, graph the percents as decimals. OB. To deemphasize the differences in foreclosure rates, rearrange the bars in decreasing order. C. To deemphasize the differences in foreclosure rates, change the scale on the y-axis to cover a smaller range, 2-6 percent, for example. OD. To deemphasize the differences in foreclosure rates, change the scale on the y-axis to cover a larger range, 0-20 percent, for example. 6.00%- 5.00%- 4.00%- 3.00%- 2.00%- 1.00%- 0.00%+ State 1 State 2 State 3 State 4 State 5 Q Garrow_forward9) Determine the net price. List price for a spark plug is $3.15. Trade- discount rate is 35%. *arrow_forwardSuppose that the Producer Price Index and the sales of Hoskin’s Wholesale Distributors for 2006 and 2018 are: What are Hoskin's real sales (also called deflated sales) for the 2 years? (Round your answers to the nearest whole dollar.)arrow_forward
arrow_back_ios
SEE MORE QUESTIONS
arrow_forward_ios
Recommended textbooks for you
 MATLAB: An Introduction with ApplicationsStatisticsISBN:9781119256830Author:Amos GilatPublisher:John Wiley & Sons Inc
 Probability and Statistics for Engineering and th...StatisticsISBN:9781305251809Author:Jay L. DevorePublisher:Cengage Learning
 Statistics for The Behavioral Sciences (MindTap C...StatisticsISBN:9781305504912Author:Frederick J Gravetter, Larry B. WallnauPublisher:Cengage Learning
 Elementary Statistics: Picturing the World (7th E...StatisticsISBN:9780134683416Author:Ron Larson, Betsy FarberPublisher:PEARSON
 The Basic Practice of StatisticsStatisticsISBN:9781319042578Author:David S. Moore, William I. Notz, Michael A. FlignerPublisher:W. H. Freeman
 Introduction to the Practice of StatisticsStatisticsISBN:9781319013387Author:David S. Moore, George P. McCabe, Bruce A. CraigPublisher:W. H. Freeman
MATLAB: An Introduction with Applications
Statistics
ISBN:9781119256830
Author:Amos Gilat
Publisher:John Wiley & Sons Inc
Probability and Statistics for Engineering and th...
Statistics
ISBN:9781305251809
Author:Jay L. Devore
Publisher:Cengage Learning
Statistics for The Behavioral Sciences (MindTap C...
Statistics
ISBN:9781305504912
Author:Frederick J Gravetter, Larry B. Wallnau
Publisher:Cengage Learning
Elementary Statistics: Picturing the World (7th E...
Statistics
ISBN:9780134683416
Author:Ron Larson, Betsy Farber
Publisher:PEARSON
The Basic Practice of Statistics
Statistics
ISBN:9781319042578
Author:David S. Moore, William I. Notz, Michael A. Fligner
Publisher:W. H. Freeman
Introduction to the Practice of Statistics
Statistics
ISBN:9781319013387
Author:David S. Moore, George P. McCabe, Bruce A. Craig
Publisher:W. H. Freeman
What is a Linear Equation in One Variable?; Author: Don't Memorise;https://www.youtube.com/watch?v=lDOYdBgtnjY;License: Standard YouTube License, CC-BY
Linear Equation | Solving Linear Equations | What is Linear Equation in one variable ?; Author: Najam Academy;https://www.youtube.com/watch?v=tHm3X_Ta_iE;License: Standard YouTube License, CC-BY