
STATISTICAL TECHNIQUES-ACCESS ONLY
16th Edition
ISBN: 9780077639648
Author: Lind
Publisher: MCG
expand_more
expand_more
format_list_bulleted
Videos
Textbook Question
Chapter 18, Problem 13E
Refer to Exercise 9 regarding the absences at Anderson Belts, Inc. Use the seasonal indexes you computed to determine the deseasonalized absences. Determine the linear trend equation based on the quarterly data for the 3 years. Forecast the seasonally adjusted absences for 2014.
9. Victor Anderson, the owner of Anderson Belts Inc., is studying absenteeism among his employees. His workforce is small, consisting of only five employees. For the last 3 years, 2011 through 2013, he recorded the following number of employee absences, in days, for each quarter.
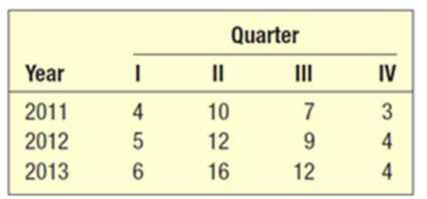
Determine a typical seasonal index for each of the four quarters.
Expert Solution & Answer
Want to see the full answer?
Check out a sample textbook solution
Students have asked these similar questions
Perdisco Limited has shared their annual sales revenue over the last 6 financial years from 2010 to 2015.
Year
Sales ($ 000)
2010
4500
2011
5100
2012
4900
2013
5400
2014
5670
2015
6000
Using linear trend equation forecast the sales revenue of Perdisco Limited for 2016.
Calculate the forecasted sales difference if you use 3-period weighted moving average designed with the following weights: 2013 (0.1), 2014 (0.3) and 2015(0.6).
Please answer this question. this is not graded question. this is from book which is provided by my teacher for understanding concepts. Please solve this as i have finding difficulty in solving.
A coffee shop owner wants to estimate demand for the next four quarters for hot chocolate.
Sales data consist of trend and seasonality. Quarter relatives are 1.06 for the first quarter, 1.03
for the second quarter, 0.61 for the third quarter, and 1.30 for the fourth quarter. Using the
appropriate values of quarter relatives and the equation Ft = 187 +9.2t for the trend
component, estimate demand for periods 9-12. (Round all calculations to two decimal points.
Demand Period 9
Demand Period 10
Demand Period 11.
Demand Period 12
r 31. You are given the following trend equation :
Y 50 +.8X
Origin 2012 ; X units one year ; Y units-profits in (000) rupees. Convert the trend equation to
a monthly trend equation and shift the origin to Jan. 1, 2013.
aigin on Ist Jul2012
1st 1, i,
Chapter 18 Solutions
STATISTICAL TECHNIQUES-ACCESS ONLY
Ch. 18 - Prob. 1SRCh. 18 - Calculate a four-quarter weighted moving average...Ch. 18 - Prob. 2ECh. 18 - Prob. 2SRCh. 18 - Prob. 3ECh. 18 - Prob. 4ECh. 18 - Prob. 5ECh. 18 - Prob. 6ECh. 18 - Sales at Tomlin Manufacturing from 2009 to 2013...Ch. 18 - Prob. 7E
Ch. 18 - Prob. 8ECh. 18 - Prob. 4SRCh. 18 - Prob. 9ECh. 18 - Prob. 10ECh. 18 - Prob. 5SRCh. 18 - Prob. 11ECh. 18 - Prob. 12ECh. 18 - Refer to Exercise 9 regarding the absences at...Ch. 18 - Prob. 14ECh. 18 - Prob. 15ECh. 18 - Prob. 16ECh. 18 - Prob. 17CECh. 18 - Prob. 18CECh. 18 - Prob. 19CECh. 18 - Prob. 20CECh. 18 - Prob. 21CECh. 18 - Prob. 22CECh. 18 - Prob. 23CECh. 18 - Prob. 24CECh. 18 - Prob. 25CECh. 18 - Prob. 26CECh. 18 - Prob. 27CECh. 18 - The quarterly production of pine lumber, in...Ch. 18 - Prob. 29CECh. 18 - Sales of roof material, by quarter, for 2007...Ch. 18 - Blueberry Farms Golf and Fish Club of Hilton Head,...Ch. 18 - Prob. 32CECh. 18 - Ray Anderson, owner of Anderson Ski Lodge in...Ch. 18 - Prob. 34CECh. 18 - Prob. 35CECh. 18 - Prob. 36CECh. 18 - Consider the variable mean amount per transaction...Ch. 18 - Prob. 38CECh. 18 - Prob. 39DECh. 18 - Prob. 1PCh. 18 - Prob. 2PCh. 18 - Prob. 3PCh. 18 - Prob. 1.1PTCh. 18 - Prob. 1.2PTCh. 18 - Prob. 1.3PTCh. 18 - Prob. 1.4PTCh. 18 - Prob. 1.5PTCh. 18 - Prob. 1.6PTCh. 18 - Prob. 1.7PTCh. 18 - Prob. 1.8PTCh. 18 - Prob. 1.9PTCh. 18 - Prob. 1.10PTCh. 18 - Prob. 2.1PTCh. 18 - Listed below are the price and quantity of several...Ch. 18 - Prob. 2.3PT
Knowledge Booster


Learn more about
Need a deep-dive on the concept behind this application? Look no further. Learn more about this topic, statistics and related others by exploring similar questions and additional content below.Similar questions
- Table 6 shows the year and the number ofpeople unemployed in a particular city for several years. Determine whether the trend appears linear. If so, and assuming the trend continues, in what year will the number of unemployed reach 5 people?arrow_forwardThe US. import of wine (in hectoliters) for several years is given in Table 5. Determine whether the trend appearslinear. Ifso, and assuming the trend continues, in what year will imports exceed 12,000 hectoliters?arrow_forwardFind the mean hourly cost when the cell phone described above is used for 240 minutes.arrow_forward
- The U.S. Census tracks the percentage of persons 25 years or older who are college graduates. That data forseveral years is given in Table 4[14]. Determine whether the trend appears linear. If so, and assuming the trendcontinues. in what year will the percentage exceed 35%?arrow_forwardStock Market The week of September 15, 2008 was one of the most volatile weeks ever for the US stock market. The closing numbers of the Dow Jones Industrial Average each day were: What was the overall change for the week? Was it positive or negative?arrow_forwardDoes Table 1 represent a linear function? If so, finda linear equation that models the data.arrow_forward
- What does the y -intercept on the graph of a logistic equation correspond to for a population modeled by that equation?arrow_forwardPlot the sales revenue figures and appropriate trend line on a graph and identify from this the choice of model for working out the seasonal component. Using the appropriate seasonal model, complete the calculations that are required to produce the required forecasts for quarters 1, 2, 3 and 4 of 2021. On the basis of your analysis explain the recommendation that you would make to ALAW Ltd regarding its future plans.arrow_forwardCryptocurrencies have rapidly become an important alternative to traditional currencies for many types of transactions. Etherium, one of the most prominent cryptocurrencies, has rapidly appreciated in value. Daily Etherium trading information for the first 332 days of 2021. It includes the following variables: Date Day – Day of the year, used to assess trend over time Volume (US $) – Daily trading volume Opening Price (US $) – Opening price for daily trading Price Change (US $) – Daily change in price from opening to close 1. Determine the sample correlation coefficient, r, between Volume and Price Change. Test the alternative hypothesis that Volume has a linear relationship to Price Change. Specifically, what are the test statistic and the p-value for that test statistic? For α = .05, what do you conclude about the relationship between the variables? (reminder: the T.DIST.2T function requires input of a positive test statistic)arrow_forward
- Please do it in Excell..arrow_forwardEloise needs to finish a 516-page report on international trade so she can present it at the big conference this weekend. She's been tracking her page count at the end of each business day to see if she's on track. Use Excel to fit a trendline to Eloise's data to create a model of her productivity. According to your model, will Eloise be able to finish her report by the end of the day next Friday? Assume she works only on weekdays. Day Pages Monday 425 Tuesday 431 Wednesday 449 Thursday 464 Friday 471 A: Use Excel to fit a trendline to Eloise's data. What are the slope and intercept for this line? The slope is The intercept is B: Use your model (trendline) to answer the question. Will Eloise finish her report by the end of next friday? Yesarrow_forwardMonthly sales have been found to follow a linear trend of y = 10 + 8x, where y is the number of items sold and x is the number of the month. Monthly deviations from the trend have been calculated and follow an additive model. In month 12, the seasonal variation is estimated to be -6. What is the forecasted number of items to be sold in month 12?arrow_forward
arrow_back_ios
SEE MORE QUESTIONS
arrow_forward_ios
Recommended textbooks for you
 Glencoe Algebra 1, Student Edition, 9780079039897...AlgebraISBN:9780079039897Author:CarterPublisher:McGraw Hill
 Big Ideas Math A Bridge To Success Algebra 1: Stu...AlgebraISBN:9781680331141Author:HOUGHTON MIFFLIN HARCOURTPublisher:Houghton Mifflin Harcourt
 Elementary AlgebraAlgebraISBN:9780998625713Author:Lynn Marecek, MaryAnne Anthony-SmithPublisher:OpenStax - Rice University
 Trigonometry (MindTap Course List)TrigonometryISBN:9781305652224Author:Charles P. McKeague, Mark D. TurnerPublisher:Cengage Learning
 College Algebra (MindTap Course List)AlgebraISBN:9781305652231Author:R. David Gustafson, Jeff HughesPublisher:Cengage Learning
Glencoe Algebra 1, Student Edition, 9780079039897...
Algebra
ISBN:9780079039897
Author:Carter
Publisher:McGraw Hill
Big Ideas Math A Bridge To Success Algebra 1: Stu...
Algebra
ISBN:9781680331141
Author:HOUGHTON MIFFLIN HARCOURT
Publisher:Houghton Mifflin Harcourt
Elementary Algebra
Algebra
ISBN:9780998625713
Author:Lynn Marecek, MaryAnne Anthony-Smith
Publisher:OpenStax - Rice University
Trigonometry (MindTap Course List)
Trigonometry
ISBN:9781305652224
Author:Charles P. McKeague, Mark D. Turner
Publisher:Cengage Learning
College Algebra (MindTap Course List)
Algebra
ISBN:9781305652231
Author:R. David Gustafson, Jeff Hughes
Publisher:Cengage Learning
Time Series Analysis Theory & Uni-variate Forecasting Techniques; Author: Analytics University;https://www.youtube.com/watch?v=_X5q9FYLGxM;License: Standard YouTube License, CC-BY
Operations management 101: Time-series, forecasting introduction; Author: Brandoz Foltz;https://www.youtube.com/watch?v=EaqZP36ool8;License: Standard YouTube License, CC-BY