
STATISTICAL TECHNIQUES-ACCESS ONLY
16th Edition
ISBN: 9780077639648
Author: Lind
Publisher: MCG
expand_more
expand_more
format_list_bulleted
Concept explainers
Videos
Textbook Question
Chapter 18, Problem 3SR
Sales at Tomlin Manufacturing from 2009 to 2013 are:
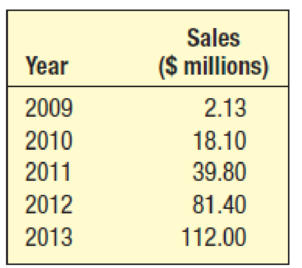
- (a) Determine the logarithmic trend equation for the sales data.
- (b) Sales increased by what percentage annually from 2009–2013?
- (c) What is the projected sales amount for 2014?
Expert Solution & Answer
Want to see the full answer?
Check out a sample textbook solution
Students have asked these similar questions
The file P02_26.xlsx lists sales (in millions of dollars) of Dell Computer during the period 1987–1997 (where year 1 corresponds to 1987).
Year
Sales
1
69
2
159
3
258
4
389
5
546
6
890
7
2014
8
2873
9
3475
10
5296
11
7759
a. Fit a power and an exponential trend curve to these data. Which fits the data better?
b. Use your part a answer to predict 1999 sales for Dell.
c. Use your part a answer to describe how the sales of Dell have grown from year to year.
Q1. The table provided gives data on indexes of output per hour (X) and real compensation per hour (Y) for the business and nonfarm business sectors of the U.S. economy for 1960–2005. The base year of the indexes is 1992 = 100 and the indexes are seasonally adjusted.
a. Plot Y against X for the two sectors separately.
b. What is the economic theory behind the relationship between the two variables? Does the scattergram support the theory?
c. Estimate the OLS regression of Y on X.
Note: on the table ( 1. Output refers to real gross domestic product in the sector. 2. Wages and salaries of employees plus employers’ contributions for social insurance and private benefit plans. 3. Hourly compensation divided by the consumer price index for all urban consumers for recent quarters.)
Thank you!
The table gives the population of the United States, in millions, for the years 1900–2010. Use a graphing
calculator with exponential regression capability to model the US population since 1900. Use the model to
estimate the population in 1925 and to predict the population in the year 2020.
Chapter 18 Solutions
STATISTICAL TECHNIQUES-ACCESS ONLY
Ch. 18 - Prob. 1SRCh. 18 - Calculate a four-quarter weighted moving average...Ch. 18 - Prob. 2ECh. 18 - Prob. 2SRCh. 18 - Prob. 3ECh. 18 - Prob. 4ECh. 18 - Prob. 5ECh. 18 - Prob. 6ECh. 18 - Sales at Tomlin Manufacturing from 2009 to 2013...Ch. 18 - Prob. 7E
Ch. 18 - Prob. 8ECh. 18 - Prob. 4SRCh. 18 - Prob. 9ECh. 18 - Prob. 10ECh. 18 - Prob. 5SRCh. 18 - Prob. 11ECh. 18 - Prob. 12ECh. 18 - Refer to Exercise 9 regarding the absences at...Ch. 18 - Prob. 14ECh. 18 - Prob. 15ECh. 18 - Prob. 16ECh. 18 - Prob. 17CECh. 18 - Prob. 18CECh. 18 - Prob. 19CECh. 18 - Prob. 20CECh. 18 - Prob. 21CECh. 18 - Prob. 22CECh. 18 - Prob. 23CECh. 18 - Prob. 24CECh. 18 - Prob. 25CECh. 18 - Prob. 26CECh. 18 - Prob. 27CECh. 18 - The quarterly production of pine lumber, in...Ch. 18 - Prob. 29CECh. 18 - Sales of roof material, by quarter, for 2007...Ch. 18 - Blueberry Farms Golf and Fish Club of Hilton Head,...Ch. 18 - Prob. 32CECh. 18 - Ray Anderson, owner of Anderson Ski Lodge in...Ch. 18 - Prob. 34CECh. 18 - Prob. 35CECh. 18 - Prob. 36CECh. 18 - Consider the variable mean amount per transaction...Ch. 18 - Prob. 38CECh. 18 - Prob. 39DECh. 18 - Prob. 1PCh. 18 - Prob. 2PCh. 18 - Prob. 3PCh. 18 - Prob. 1.1PTCh. 18 - Prob. 1.2PTCh. 18 - Prob. 1.3PTCh. 18 - Prob. 1.4PTCh. 18 - Prob. 1.5PTCh. 18 - Prob. 1.6PTCh. 18 - Prob. 1.7PTCh. 18 - Prob. 1.8PTCh. 18 - Prob. 1.9PTCh. 18 - Prob. 1.10PTCh. 18 - Prob. 2.1PTCh. 18 - Listed below are the price and quantity of several...Ch. 18 - Prob. 2.3PT
Knowledge Booster


Learn more about
Need a deep-dive on the concept behind this application? Look no further. Learn more about this topic, statistics and related others by exploring similar questions and additional content below.Similar questions
- The Internal Revenue Service Restructuring and Reform Act (RRA) was signed into law by President Bill Clinton in 1998. A major objective of the RRA was to promote electronic filing of tax returns. The data in the table that follows show the percentage of individual income tax returns filed electronically for filing years 2000–2008. Since the percentage P of returns filed electronically depends on the filing year y and each input corresponds to exactly one output, the percentage of returns filed electronically is a function of the filing year;so P(y) represents the percentage of returns filed electronically for filing year y. (a) Find the average rate of change of the percentage of e-filed returns from 2000 to 2002. (b) Find the average rate of change of the percentage of e-filed returns from 2004 to 2006. (c) Find the average rate of change of the percentage of e-filed returns from 2006 to 2008. (d) What is happening to the average rate of change as time passes?arrow_forwardThe Following are the Index Numbers of prices (2002 = 100) %3D Year Index Year Index 2002 100 2007 410 2003 110 2008 400 2004 120 2009 380 2005 200 2010 370 2006 400 2011 340 Shift the base from 2002 – 2008 and recast the Index Numbers.arrow_forwardALZHEIMER'S DISEASE-As baby boomers enter their golden years, the number of people afflicted with Alzheimer's disease is expected to rise dramatically. In a study published in the Journal of Neurology, the number of people with Alzheimer's disease in the United States age 65 and over is projected to be 0.00525t2 0.075t + 4.7 N(t) (0 ts 4) million in decade t, where t=0 corresponds to 2010 a. What is the projected number of people with Alzheimer's disease in the United States age 65 years and over in 2030?arrow_forward
- The table shows the historical in-state tuition rates for the University of Kalamazoo. Use the data to answer the questions and round your answers to two decimal places. Academic year Rate of tuition for one semester 2008–2009 $3,812 2009–2010 $4,002 2010–2011 $4,441 2011–2012 $4,905 2012–2013 $5,181 What is the percentage increase in tuition from the 2008–2009 school year to the 2012–2013 school year?arrow_forward. Population Growth and Decline The table gives the population in a small coastal community for the period 1997–2006.Figures shown are for January 1 in each year.(a) What was the average rate of change of populationbetween 1998 and 2001?(b) What was the average rate of change of populationbetween 2002 and 2004?(c) For what period of time was the population increasing?(d) For what period of time was the population decreasing?arrow_forwardThe population of a certain city was 118,000 in 1994, and the observed relative growth rate is 3% per year.arrow_forward
- Q. Table provided gives data on gross domestic product (GDP) for the United States for the years 1959–2005. a. Plot the GDP data in current and constant (i.e., 2000) dollars against time. b. Letting Y denote GDP and X time (measured chronologically starting with 1 for 1959, 2 for 1960, through 47 for 2005), see if the following model fits the GDP data: Yt = β1 + β2 Xt + ut Estimate this model for both current and constant-dollar GDP. c. How would you interpret β2? d. If there is a difference between β2 estimated for current-dollar GDP and that estimated for constant-dollar GDP, what explains the difference? e. From your results what can you say about the nature of inflation in the United States over the sample period?arrow_forwardGiven:(1, 2.0), (1.5, 3.5), (2, 4.0), (4, 5.8), (6, 7.0), (8, 7.8).(a) use a graphing utility to create a scatter plot of the data, (b) decide whether the data could best be modeled by a linear model, an exponential model, or a logarithmic model, (c) explain why you chose the model you did in part (b), (d) use the regression feature of the graphing utility to find the model you chose in part (b) for the data and graph the model with the scatter plot, and (e) determine how well the model you chose fits the data.arrow_forwardDoes a linear, exponential, or logarithmic model best fit the data in Table 2? Find the model.arrow_forward
- Enter the data from Table 2 into a graphing calculator and graph the ranking scatter plot. Determine whetherthe data from the table would likely represent a function that is linear, exponential, or logarithmic.arrow_forwardTable 3 gives the annual sales (in millions of dollars) of a product from 1998 to 20006. What was the average rate of change of annual sales (a) between 2001 and 2002, and (b) between 2001 and 2004?arrow_forwardThe number N of locations of a popular coffeehouse chain is given in the table. (The numbers of locations as of October 1 are given.) Year 2004 2005 2006 2007 2008 8567 10,244 12,441 15,011 16,683 (a) Find the average rate of growth between each pair of years. 2004 to 2006 locations/year 2006 to 2007 locations/year 2005 to 2006 locations/year (b) Estimate the instantaneous rate of growth in 2006 by taking the average of the last two rates of change in part (a). locations/year (c) Estimate the instantaneous rate of growth in 2006 by measuring the slope of the secant line through (2005, 10244) and (2007, 15011). locations/year (d) Estimate the instantaneous rate of growth in 2007 by measuring the slope of the secant line through (2006, 12441) and (2008, 16683). locations/year Compare the growth rates you obtained in part (c) and (d). What can you conclude? O The rate of growth is decreasing. There is not enough information. The rate of growth is constant. The rate of growth is…arrow_forward
arrow_back_ios
SEE MORE QUESTIONS
arrow_forward_ios
Recommended textbooks for you

 Algebra & Trigonometry with Analytic GeometryAlgebraISBN:9781133382119Author:SwokowskiPublisher:Cengage
Algebra & Trigonometry with Analytic Geometry
Algebra
ISBN:9781133382119
Author:Swokowski
Publisher:Cengage
01 - What Is A Differential Equation in Calculus? Learn to Solve Ordinary Differential Equations.; Author: Math and Science;https://www.youtube.com/watch?v=K80YEHQpx9g;License: Standard YouTube License, CC-BY
Higher Order Differential Equation with constant coefficient (GATE) (Part 1) l GATE 2018; Author: GATE Lectures by Dishank;https://www.youtube.com/watch?v=ODxP7BbqAjA;License: Standard YouTube License, CC-BY
Solution of Differential Equations and Initial Value Problems; Author: Jefril Amboy;https://www.youtube.com/watch?v=Q68sk7XS-dc;License: Standard YouTube License, CC-BY