
UNIVERSE LL W/SAPLINGPLUS MULTI SEMESTER
11th Edition
ISBN: 9781319278670
Author: Freedman
Publisher: MAC HIGHER
expand_more
expand_more
format_list_bulleted
Concept explainers
Question
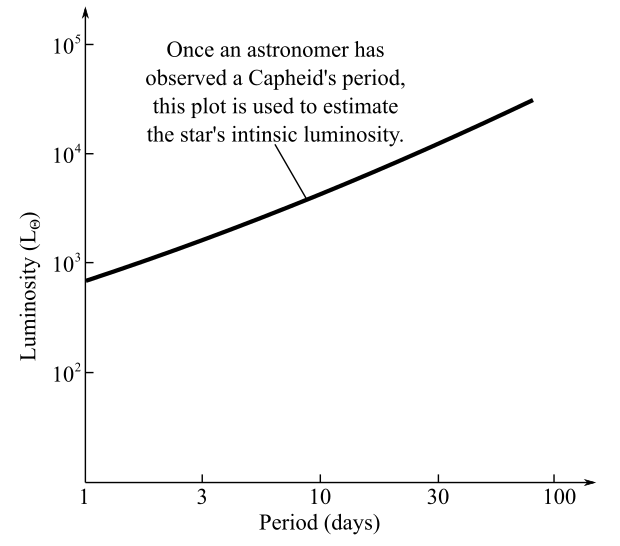
Chapter 19, Problem 61Q
To determine
The approximate period of a variable star by considering the figure below, showing the period-luminous relation for Cepheids. Also, consider that a certain Cepheid star has an average luminosity of
Expert Solution & Answer
Want to see the full answer?
Check out a sample textbook solution
Chapter 19 Solutions
UNIVERSE LL W/SAPLINGPLUS MULTI SEMESTER
Ch. 19 - Prob. 1CCCh. 19 - Prob. 2CCCh. 19 - Prob. 3CCCh. 19 - Prob. 4CCCh. 19 - Prob. 5CCCh. 19 - Prob. 6CCCh. 19 - Prob. 7CCCh. 19 - Prob. 8CCCh. 19 - Prob. 9CCCh. 19 - Prob. 10CC
Ch. 19 - Prob. 11CCCh. 19 - Prob. 12CCCh. 19 - Prob. 13CCCh. 19 - Prob. 14CCCh. 19 - Prob. 15CCCh. 19 - Prob. 1QCh. 19 - Prob. 2QCh. 19 - Prob. 3QCh. 19 - Prob. 4QCh. 19 - Prob. 5QCh. 19 - Prob. 6QCh. 19 - Prob. 7QCh. 19 - Prob. 8QCh. 19 - Prob. 9QCh. 19 - Prob. 10QCh. 19 - Prob. 11QCh. 19 - Prob. 12QCh. 19 - Prob. 13QCh. 19 - Prob. 14QCh. 19 - Prob. 15QCh. 19 - Prob. 16QCh. 19 - Prob. 17QCh. 19 - Prob. 18QCh. 19 - Prob. 19QCh. 19 - Prob. 20QCh. 19 - Prob. 21QCh. 19 - Prob. 22QCh. 19 - Prob. 23QCh. 19 - Prob. 24QCh. 19 - Prob. 25QCh. 19 - Prob. 26QCh. 19 - Prob. 27QCh. 19 - Prob. 28QCh. 19 - Prob. 29QCh. 19 - Prob. 30QCh. 19 - Prob. 31QCh. 19 - Prob. 32QCh. 19 - Prob. 33QCh. 19 - Prob. 34QCh. 19 - Prob. 35QCh. 19 - Prob. 36QCh. 19 - Prob. 37QCh. 19 - Prob. 38QCh. 19 - Prob. 39QCh. 19 - Prob. 40QCh. 19 - Prob. 41QCh. 19 - Prob. 42QCh. 19 - Prob. 43QCh. 19 - Prob. 44QCh. 19 - Prob. 45QCh. 19 - Prob. 46QCh. 19 - Prob. 47QCh. 19 - Prob. 48QCh. 19 - Prob. 49QCh. 19 - Prob. 50QCh. 19 - Prob. 51QCh. 19 - Prob. 52QCh. 19 - Prob. 53QCh. 19 - Prob. 61Q
Knowledge Booster


Learn more about
Need a deep-dive on the concept behind this application? Look no further. Learn more about this topic, physics and related others by exploring similar questions and additional content below.Similar questions
- Figure 19.9 is the light curve for the prototype cepheid variable Delta Cephei. How does the luminosity of this star compare with that of the Sun? Figure 19.9 Cepheid Light Curve. This light curve shows how the brightness changes with time for a typical cepheid variable, with a period of about 6 days.arrow_forwardTable 17.2 lists the temperature ranges that correspond to the different spectral types. What part of the star do these temperatures refer to? Why?arrow_forwardAccording to the text, a star must be hotter than about 25,000 K to produce an H II region. Both the hottest white dwarfs and main-sequence O stars have temperatures hotter than 25,000 K. Which type of star can ionize more hydrogen? Why?arrow_forward
- Appendix J lists the stars that appear brightest in our sky. Are most of these hotter or cooler than the Sun? Can you suggest a reason for the difference between this answer and the answer to the previous question? (Hint: Look at the luminosities.) Is there any tendency for a correlation between temperature and luminosity? Are there exceptions to the correlation?arrow_forwardIf a 100 solar mass star were to have a luminosity of 107 times the Sun’s luminosity, how would such a star’s density compare when it is on the main sequence as an O-type star, and when it is a cool supergiant (M-type)? Use values of temperature from Figure 18.14 or Figure 18.15 and the relationship between luminosity, radius, and temperature as given in Exercise 18.47. Figure 18.15 Schematic HR Diagram for Many Stars. Ninety percent of all stars on such a diagram fall along a narrow band called the main sequence. A minority of stars are found in the upper right; they are both cool (and hence red) and bright, and must be giants. Some stars fall in the lower left of the diagram; they are both hot and dim, and must be white dwarfs. Figure 18.14 HR Diagram for a Selected Sample of Stars. In such diagrams, luminosity is plotted along the vertical axis. Along the horizontal axis, we can plot either temperature or spectral type (also sometimes called spectral class). Several of the brightest stars are identified by name. Most stars fall on the main sequence.arrow_forwardH II regions can exist only if there is a nearby star hot enough to ionize hydrogen. Hydrogen is ionized only by radiation with wavelengths shorter than 91.2 nm. What is the temperature of a star that emits its maximum energy at 91.2 nm? (Use Wien’s law from Radiation and Spectra.) Based on this result, what are the spectral types of those stars likely to provide enough energy to produce H II regions?arrow_forward
arrow_back_ios
arrow_forward_ios
Recommended textbooks for you
 AstronomyPhysicsISBN:9781938168284Author:Andrew Fraknoi; David Morrison; Sidney C. WolffPublisher:OpenStax
 Stars and Galaxies (MindTap Course List)PhysicsISBN:9781337399944Author:Michael A. SeedsPublisher:Cengage Learning
 Foundations of Astronomy (MindTap Course List)PhysicsISBN:9781337399920Author:Michael A. Seeds, Dana BackmanPublisher:Cengage Learning
Astronomy
Physics
ISBN:9781938168284
Author:Andrew Fraknoi; David Morrison; Sidney C. Wolff
Publisher:OpenStax
Stars and Galaxies (MindTap Course List)
Physics
ISBN:9781337399944
Author:Michael A. Seeds
Publisher:Cengage Learning
Foundations of Astronomy (MindTap Course List)
Physics
ISBN:9781337399920
Author:Michael A. Seeds, Dana Backman
Publisher:Cengage Learning