Connect Access Card for Financial Accounting: Information and Decisions
8th Edition
ISBN: 9781259662966
Author: John J Wild
Publisher: McGraw-Hill Education
expand_more
expand_more
format_list_bulleted
Videos
Textbook Question
Chapter 2, Problem 10BTN
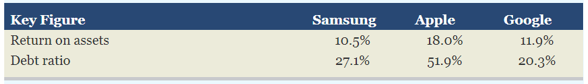
Samsung (www.Samsung.com) is a market leader in high-tech electronics manufacturing and digital media, and it competes to some extent with both Apple and Google. Key financial ratios for the current fiscal year follow.
Required
- Which company is most profitable according to its return on assets?
- Which company is most risky according to the debt ratio?
- Which company deserves increased investment based on a joint analysis of return on assets and the debt ratio? Explain.
Expert Solution & Answer
Want to see the full answer?
Check out a sample textbook solution
Students have asked these similar questions
Carson Electronics’ management has long viewed BGT Electronics as an industry leader and uses this firm as a model firm for analyzing its own performance. The balance sheet and income statements for the two firms are as follows:
Calculate the following ratios for both Carson and BGT:
a) Debt ratio:
b) Average collection period:
c) Fixed asset turnover:
d) Return on equity:
The DuPont equation shows the relationships among asset management, debt management, and ratios. Management can use the DuPont equation to analyze ways of improving the firm's performance. Its equation is:
Ratio analysis is important to understand and interpret financial statements; however, sound financial analysis involves more than just calculating and interpreting numbers. factors also need to be considered.
Quantitative Problem: Rosnan Industries' 2022 and 2021 balance sheets and income statements are shown below.
Balance Sheets
2022
2021
Assets
Cash and equivalents
$
70
$
55
Accounts receivable
275
300
Inventories
375
350
Total current assets
$
720
$
705
Net plant and equipment
2,000
1,490
Total assets
$
2,720
$
2,195
Liabilities and Equity
Accounts payable
$
150
$
85
Accruals
75
50…
If given the opportunity, in which of the firms would you invest based on the result of your analysis of both companies and the comparison with the industry? If you would not invest, explain your reasons according to the results obtained.
Company Name:
Year 2018
Chemicals and Allied Products Industry Ratios
…………..
Solvency or Debt Ratios
Merck
J&J
2018
Debt ratio
0.67
0.61
0.47
Debt-to-equity ratio
0.93
0.51
0.38
Interest coverage ratio
12.27
18.91
-9.43
Liquidity Ratios
Current ratio
1.17
1.47
3.47
Quick ratio
0.92
1.16
2.12
Cash ratio
0.40
0.63
2.24
Profitability Ratios
Profit margin
14.64%
18.75%
-93.4%
ROE (Return on equity), after tax
23.03%
25.60%
-248.5
ROA (Return on assets)
7.49%
10.00%
-146.5
Gross margin
68.06%
66.79%
55.3%
Operating margin (Return on sales)
19.62%
24.27%…
Chapter 2 Solutions
Connect Access Card for Financial Accounting: Information and Decisions
Ch. 2 - Provide the names of two (a) asset accounts, (b)...Ch. 2 - What is the difference between a note payable and...Ch. 2 - Prob. 3DQCh. 2 - Prob. 4DQCh. 2 - Prob. 5DQCh. 2 - Should a transaction be recorded first in a...Ch. 2 - Prob. 7DQCh. 2 - Why does the recordkeeper prepare a trial balance?Ch. 2 - Prob. 9DQCh. 2 - Prob. 10DQ
Ch. 2 - Prob. 11DQCh. 2 - Prob. 12DQCh. 2 - Prob. 13DQCh. 2 - Prob. 14DQCh. 2 - Prob. 15DQCh. 2 - Review the Apple balance sheet in Appendix A....Ch. 2 - Prob. 17DQCh. 2 - Prob. 18DQCh. 2 - Identify the items from the following list that...Ch. 2 - Prob. 2QSCh. 2 - Prob. 3QSCh. 2 - Prob. 4QSCh. 2 - Prob. 5QSCh. 2 - Prob. 6QSCh. 2 - Prob. 7QSCh. 2 - Prob. 8QSCh. 2 - Prob. 9QSCh. 2 - Prob. 11QSCh. 2 - Prob. 1ECh. 2 - Prob. 2ECh. 2 - Prob. 3ECh. 2 - Prob. 4ECh. 2 - Prob. 5ECh. 2 - Prob. 6ECh. 2 - Prob. 7ECh. 2 - Prob. 9ECh. 2 - Prob. 11ECh. 2 - Prob. 12ECh. 2 - Prob. 13ECh. 2 - Prob. 14ECh. 2 - A corporation had the following assets and...Ch. 2 - Prob. 16ECh. 2 - Prob. 17ECh. 2 - Prob. 18ECh. 2 - Prob. 19ECh. 2 - Prob. 20ECh. 2 - Prob. 21ECh. 2 - Prob. 22ECh. 2 - Prob. 1PSACh. 2 - Prob. 2PSACh. 2 - Prob. 3PSACh. 2 - Prob. 4PSACh. 2 - Prob. 5PSACh. 2 - Prob. 1PSBCh. 2 - Prob. 2PSBCh. 2 - Prob. 3PSBCh. 2 - Nuncio Consulting complete the following...Ch. 2 - Prob. 5PSBCh. 2 - Prob. 2SPCh. 2 - Prob. 1BTNCh. 2 - Key comparative figures for Apple and Google...Ch. 2 - Assume that you are a cashier and your manager...Ch. 2 - Prob. 4BTNCh. 2 - Prob. 6BTNCh. 2 - Prob. 7BTNCh. 2 - Prob. 8BTNCh. 2 - Samsung (www.Samsung.com) is a market leader in...
Knowledge Booster


Learn more about
Need a deep-dive on the concept behind this application? Look no further. Learn more about this topic, accounting and related others by exploring similar questions and additional content below.Similar questions
- DuPont system of analysis Use the following financial information for AT&T and Verizon to conduct a DuPont system of analysis for each company. Sales Earnings available for common stockholders Total assets Stockholders' equity a. Which company has the higher net profit margin? Higher asset turnover? b. Which company has the higher ROA? The higher ROE? c. Which company has the higher financial leverage multiplier? a. Net profit margin (Round to three decimal places.) AT&T Net profit margin AT&T $164,000 13,333 403,921 201,934 Verizon Verizon $126,280 13,608 244,280 24,232arrow_forwardSelected financial data for Surf City and Paradise Falls are as follows:Required:1. Calculate the debt to equity ratio for Surf City and Paradise Falls for the most recent year. Which company has the higher ratio?2. Calculate the return on assets for Surf City and Paradise Falls. Which company appears more profitable?3. Calculate the times interest earned ratio for Surf City and Paradise Falls. Which company is better able to meet interest payments as they become due?arrow_forwardFinancial Statement Analysis tells you if your company is on the right track. Are you growing, making more money? Find out why the Liquidity, Leverage, Profitability, and Cash Flow Ratios are so important to a company's survival? List at least '1' for each category, describing how it is calculated, and what it means.arrow_forward
- Selected financial data for Bahama Bay and Caribbean Key are as follows:Required:1. Calculate the debt to equity ratio for Bahama Bay and Caribbean Key for the most recent year. Which company has the higher ratio?2. Calculate the return on assets for Bahama Bay and Caribbean Key. Which company appears more profitable?3. Calculate the times interest earned ratio for Bahama Bay and Caribbean Key. Which company is better able to meet interest payments as they become due?arrow_forwardAnalyze the financial statements of the company to you in terms of:1. Solvency Ratio: *Equity Ratio 2. Asset Management Ratio: *Invetory Turnover Ratio *Fixed Asset Turnover Ratio *Total Asset Turnover Ratio 3. Debt Management Ratio: *Time Interest Earned Ratio 4. Profitability Ratio: *Operating Margin *Return on Total Assets *Return on Common Equity.…arrow_forwardCompose a financial analysis based on your evaluation of the ratios. Comparison between 2020E ratios and industry averages - (c) Asset utilization ratios; (1) Are the 2020E ratios above, below, or equal to the industryaverages? 2) Is this a good thing or a bad thing for the company? and (3) What can be done to improve the weak ratios or to maintainthe strong ones? (d) Profitability ratios (1) Are the 2020E ratios above, below, or equal to the industryaverages? ( 2) Is this a good thing or a bad thing for the company? and (3) What can be done to improve the weak ratios or to maintainthe strong ones? (e) Market performance ratios. (1) Are the 2020E ratios above, below, or equal to the industryaverages? ( 2) Is this a good thing or a bad thing for the company? and (3) What can be done to improve the weak ratios or to maintainthe strong ones?arrow_forward
- What comment can be made on this or what can be added? The Weighted Average Cost of Capital (WACC) is a financial analytical tool that is essentially a calculation utilizing a company's market value of equity, debt, and tax rate. This allows both the company and investors an estimated net value of the company and can give indications of the value of the company moving forward. The WACC is especially important for a company to understand because the WACC is a good indication of the success or failure of a company's current investment strategy and if favorable, can assist a company when it comes to purchases of sales or other acquisitionsarrow_forwardWhat is the purpose of a financial ratio analysis? Define a financial ratio for each of the following: Liquidity Ratios Leverage Ratios Activity Ratios Profitability Ratios Growth Ratio Which do you think is/are most important to a company like walmart in making financial strategic decisions? Why?arrow_forwardYou wish to compute a firm's sustainable growth rate from its accounting statements. To do so, you could use the values of: Question 3 options: A) Total assets, net income, and the retention ratio. B) Net income, equity, and total assets. C) Net income, equity, and the dividend payout ratio. D) Interest paid, equity, and total assets. E) Total assets, interest paid, and equity.arrow_forward
- Using the data in the following table for a number of firms in the same industry, dothe following:•a. Compute the total asset turnover, the net profit margin, the equity multiplier, andthe return on equity for each firm.b. Evaluate each firm’s performance by comparing the firms with one another.Which firm or firms appear to be having problems? What corrective actionwould you suggest the poorer performing firms take? Finally, what additional data would you want to have on hand when conducting youranalyses?Firm (in million Dollars A B C D Sales $20 $10 $15 $25 Net Income after sales 3 0.5 2.25 3 Total Assets 15 7.5 15 24 Stockholders’ Equity 10 5 14 10arrow_forwardSee Image for Information Compute the following performance indices for both companies: Profit margin Asset turnover Return on Capital Employed (ROCE) Current ratio Debt equity ratio Compare and analyse the performance of the two companies computed in (1) above and explain what the board of Box Limited needs to do to achieve their objective . c. Which other non-financial measures can influence the decision of the board of Box Limited?arrow_forwardQUESTIONS: 6. Is ABC, Inc. profitable? 7. Is the company's financial performance improving based on the two year data presented? 8. Is the company heavily financed by debt or equity?arrow_forward
arrow_back_ios
SEE MORE QUESTIONS
arrow_forward_ios
Recommended textbooks for you

 EBK CONTEMPORARY FINANCIAL MANAGEMENTFinanceISBN:9781337514835Author:MOYERPublisher:CENGAGE LEARNING - CONSIGNMENT
EBK CONTEMPORARY FINANCIAL MANAGEMENT
Finance
ISBN:9781337514835
Author:MOYER
Publisher:CENGAGE LEARNING - CONSIGNMENT
Financial ratio analysis; Author: The Finance Storyteller;https://www.youtube.com/watch?v=MTq7HuvoGck;License: Standard Youtube License