
EBK FUNDAMENTALS OF BIOSTATISTICS
8th Edition
ISBN: 9781305465510
Author: Rosner
Publisher: YUZU
expand_more
expand_more
format_list_bulleted
Concept explainers
Videos
Textbook Question
Chapter 2, Problem 25P
Forced expiratory volume (FEV) is an index of pulmonary
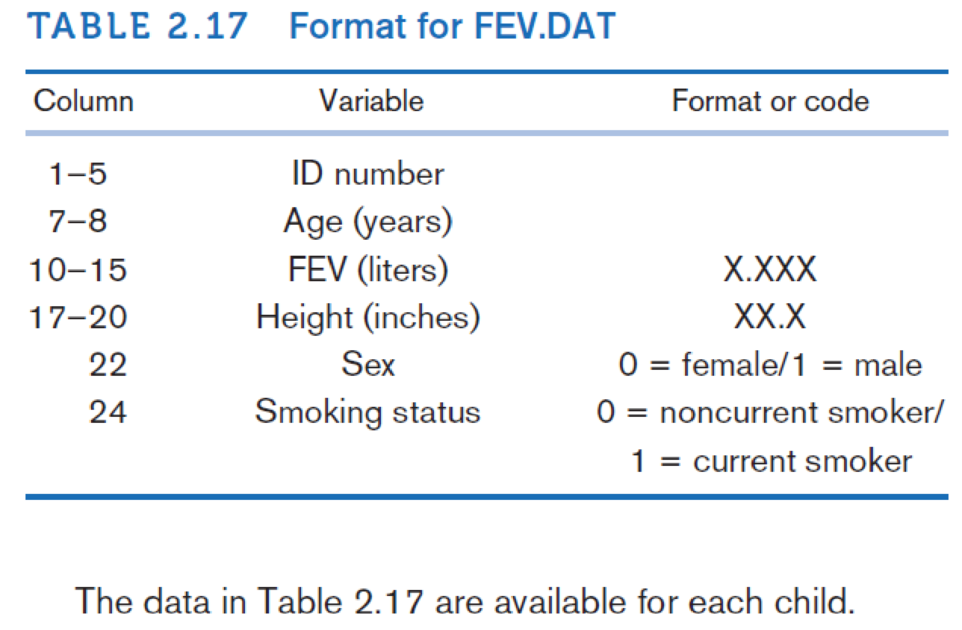
Compare the pattern of growth of FEV by age for boys and girls. Are there any similarities? Any differences? Hint: Compute the mean FEV by age group (3-4/5-9/10- 14/ 15-19) separately for boys and girls and plot the meanFEV by age.
Expert Solution & Answer
Want to see the full answer?
Check out a sample textbook solution
Students have asked these similar questions
Ankle Brachial Index. The ankle brachial index (ABI) compares the blood pressure of a patient’s arm to the blood pressure of the patient’s leg. The ABI can be an indicator of different diseases, including arterial diseases. A healthy (or normal) ABI is 0.9 or greater. In a study by M. McDermott et al. titled “Sex Differences in Peripheral Arterial Disease: Leg Symptoms and Physical Functioning” (Journal of the American Geriatrics Society, Vol. 51, No. 2, pp. 222–228), the researchers obtained the ABI of 187 women with peripheral arterial disease. The results were a mean ABI of 0.64 with a standard deviation of 0.15. At the 1% significance level, do the data provide sufficient evidence to conclude that, on average, women with peripheral arterial disease have an unhealthy ABI?
Peak expiratory flow (PEF) is a measure of a patient’s ability to expel air from the lungs. Patients with asthma or other respiratory conditions often have restricted PEF. The mean PEF for children free of asthma is 306. An investigator conducts a study to investigate whether there is a difference in mean PEF in children with chronic bronchitis as compared to those without asthma or other respiratory conditions that often have restricted PEF. Data on PEF are collected and summarized below. Based on the data, is there statistical evidence of a lower mean PEF in children with chronic bronchitis as compared to those without? Run the appropriate test at α = 0.05.
Group
Number of Children
Mean PEF
Std Dev PEF
Chronic Bronchitis
25
274
59
No Chronic Bronchitis
25
317
73
Climate change 2013 Data collected from around the globe show that the earth is getting
warmer. The most common theory relates climate change to an increase in atmospheric levels of carbon
dioxide (CO2), a greenhouse gas. The mean annual CO2 concentration in the atmosphere (parts per
million) is measured at the top of Mauna Loa in Hawaii (away from any local contaminants) and
available at ftp://aftp.cmdl.noaa.gov/products/trends/co2/co2_annmean_mlo.txt
The mean surface air temperature is recorded as the change in °C relative to a base period of 1951 to
1980. It is available at data.giss.nasa.gov/gistemp/graphs_v3/
Here are a scatterplot and regression for the years from 1970 to 2013:
14.6 +
14.4 +
14.2 +
14.0
340
360
380
CO2
Response variable is
R-squared = 73.6% R-squared (adjusted) = 72.9%
s = 0.1316 with 44 – 2 = 42 degrees of freedom
Global Avg Temp
Variable
Coefficient
SE(Coeff)
t-Ratio
P-Value
Intercept
10.6442
0.3418
31.1
S0.0001
0.010325
0.0010
10.8
S0.0001
a) Write the…
Chapter 2 Solutions
EBK FUNDAMENTALS OF BIOSTATISTICS
Ch. 2.6 - When is it appropriate to use the arithmetic mean...Ch. 2.6 - How does the geometric mean differ from the...Ch. 2.6 - What is the difference between the standard...Ch. 2.8 - What is a stem-and-leaf plot? How does it differ...Ch. 2.8 - Prob. B.2RECh. 2.8 - Consider the stem-and-leaf plot in Figure 2.6. Is...Ch. 2.8 - What is a box plot? What additional information...Ch. 2 - The data in Table 2.13 are a sample from a larger...Ch. 2 - The data in Table 2.13 are a sample from a larger...Ch. 2 - It is of clinical interest to know if the duration...
Ch. 2 - Suppose the scale for a data set is changed by...Ch. 2 - Suppose the scale for a data set is changed by...Ch. 2 - Suppose the scale for a data set is changed by...Ch. 2 - Suppose the scale for a data set is changed by...Ch. 2 - A man runs 1 mile approximately once per weekend....Ch. 2 - A man runs 1 mile approximately once per weekend....Ch. 2 - A man runs 1 mile approximately once per weekend....Ch. 2 - A man runs 1 mile approximately once per weekend....Ch. 2 - A man runs 1 mile approximately once per weekend....Ch. 2 - The data in Table 2.15 are a sample of cholesterol...Ch. 2 - The data in Table 2.15 are a sample of cholesterol...Ch. 2 - The data in Table 2.15 are a sample of cholesterol...Ch. 2 - The data in Table 2.15 are a sample of cholesterol...Ch. 2 - The data in Table 2.15 are a sample of cholesterol...Ch. 2 - In an experiment that examined the effect of body...Ch. 2 - In an experiment that examined the effect of body...Ch. 2 - Table 2.17 Format for FEV.DAT The data in Table...Ch. 2 - Forced expiratory volume (FEV) is an index of...Ch. 2 - Forced expiratory volume (FEV) is an index of...Ch. 2 - Prob. 26PCh. 2 - The food-frequency questionnaire (FFQ) is an...Ch. 2 - In Section 2.9, we described Data Set LEAD.DAT (at...Ch. 2 - In Section 2.9, we described Data Set LEAD.DAT (at...Ch. 2 - Activated-protein-C (APC) resistance is a serum...Ch. 2 - Activated-protein-C (APC) resistance is a serum...Ch. 2 - A study was conducted to demonstrate that soy...Ch. 2 - A study was conducted to demonstrate that soy...Ch. 2 - A study was conducted to demonstrate that soy...Ch. 2 - Prob. 38PCh. 2 - In Section 2.10, we described Data Set BONEDEN.DAT...Ch. 2 - What impression do you have of the relationship...Ch. 2 - In Section 2.10, we described Data Set BONEDEN.DAT...Ch. 2 - In Section 2.10, we described Data Set BONEDEN.DAT...Ch. 2 - Prob. 43PCh. 2 - Prob. 44PCh. 2 - Prob. 45PCh. 2 - Answer Problems 2.382.40 for BMD for the femoral...Ch. 2 - The Left Ventricular Mass lndex (LVMI) is a...Ch. 2 - Prob. 48PCh. 2 - Prob. 49PCh. 2 - The Left Ventricular Mass lndex (LVMI) is a...
Knowledge Booster


Learn more about
Need a deep-dive on the concept behind this application? Look no further. Learn more about this topic, statistics and related others by exploring similar questions and additional content below.Similar questions
- Find the mean hourly cost when the cell phone described above is used for 240 minutes.arrow_forwardWhat does the y -intercept on the graph of a logistic equation correspond to for a population modeled by that equation?arrow_forwardHashim Motors Sdn. Bhd. specializes in selling a secondhand car. Currently, the company has 12 used cars for sale. The owner of the company wants to investigate the relationship between the age of the car and the mileage of the car. The data were collected and analyzed using SPSS. The results as follow. Car's age (years) | 6 4 2 2.5 3 Mileage ('000 km) | 93 60 33 36 53 59 48 77 4 5 5.5 4.5 4.5 3.5 79 61 63 50 3 Model Summary Adjusted R Std. Error of the Model R R Square Square Estimate 1 .975 .951 .946 4.036 a. Predictors: (Constant), Agearrow_forward
- The heart rate of humans are normally distributed with a mean of 90.3 bpm and std. dev. of 7.3 bpm. What are the heartbeats that separate the lower 25% from the rest and the upper 20% from the rest?arrow_forwardRetinitis pigmentosa (RP) is a hereditary ocular diseasein which patches of pigment appear on the retina, potentially resulting in substantial vision loss and in somecases complete blindness. An important issue is how fastthe subjects decline. Visual field is an important measureof area of vision, which is measured in degree2. A visualfield area for a normal person is around 11,000 degree2.The longitudinal data in Table 11.29 were provided by anindividual patient.Table 11.29 Longitudinal visual field data forone RP patientTime Visual field area lnVisit (yr) (degree2) (visual field area)1 0 3059 8.032 1 3053 8.023 2 1418 7.264 3 1692 7.435 4 1978 7.596 5 1567 7.367 6 1919 7.568 7 1998 7.609 11 1648 7.4110 13 1721 7.4511 15 1264 7.14mean 6.09 1938 7.532sd 4.97 597 0.280Suppose the rate of change of ln (visual field) is a linearfunction of follow-up time.11.103 Write down a linear regression model that summarizes this relationship.11.104 Fit the regression line using the method of…arrow_forwardRetinitis pigmentosa (RP) is a hereditary ocular diseasein which patches of pigment appear on the retina, potentially resulting in substantial vision loss and in somecases complete blindness. An important issue is how fastthe subjects decline. Visual field is an important measureof area of vision, which is measured in degree2. A visualfield area for a normal person is around 11,000 degree2.The longitudinal data in Table 11.29 were provided by anindividual patient.Table 11.29 Longitudinal visual field data forone RP patientTime Visual field area lnVisit (yr) (degree2) (visual field area)1 0 3059 8.032 1 3053 8.023 2 1418 7.264 3 1692 7.435 4 1978 7.596 5 1567 7.367 6 1919 7.568 7 1998 7.609 11 1648 7.4110 13 1721 7.4511 15 1264 7.14mean 6.09 1938 7.532sd 4.97 597 0.280Suppose the rate of change of ln (visual field) is a linearfunction of follow-up time.11.103 Write down a linear regression model that summarizes this relationship.arrow_forward
- Please help me figure this out. Thank you :)arrow_forwardwhat data do into spss to receive the answers?arrow_forwardANOTHER The negative effects of ambient air pollution on children's lung function has been well established, but less research is available about the impact of indoor air pollution. The authors of an article investigated the relationship between indoor air-pollution metrics and lung function growth among children ages 6-13 years living in four Chinese cities. For each subject in the study, the authors measured an important lung-capacity index known as FEV₁, the forced volume (in ml) of air that is exhaled in 1 second. Higher FEV₁ values are associated with greater lung capacity. Among the children in the study, 516 came from households that used coal for cooking or heating or both. Their FEV₁ mean was 1427 with a standard deviation of 325. (A complex statistical procedure was used to show that burning coal had a clear negative effect on mean FEV, levels.) (a) Calculate and interpret a 95% (two-sided) confidence interval for true average FEV, level in the population of all children from…arrow_forward
- Glaucoma is a leading cause of blindness in the United States, N. Ehlers measured the difference in corneal thickness (in microns) between the two eyes of eight patients. Each patient had one eye that had glaucoma and one eye that was normal. The difference was measured as the corneal thickness of normal eye – corneal thickness of eye with Glaucoma. Corneal thickness is important because it can mask an accurate reading of eye pressure. Question: If a participant has the same corneal thickness in their normal eye as the eye with Glaucoma, what would be the value for difference: measured as the corneal thickness of normal eye – corneal thickness of eye with Glaucoma.arrow_forwardGlaucoma is a leading cause of blindness in the United States, N. Ehlers measured the difference in corneal thickness (in microns) between the two eyes of eight patients. Each patient had one eye that had glaucoma and one eye that was normal. The difference was measured as the corneal thickness of normal eye – corneal thickness of eye with Glaucoma. Corneal thickness is important because it can mask an accurate reading of eye pressure. Question:If the t statistic falls below the effect size in which we reject the null, but the p value is greater than 0.05. Do i reject the null? As my scenario had no population mean because the differences were recorded, do i set a test value of 10 or keep it at 0?arrow_forwardGlaucoma is a leading cause of blindness in the United States, N. Ehlers measured the difference in corneal thickness (in microns) between the two eyes of eight patients. Each patient had one eye that had glaucoma and one eye that was normal. The difference was measured as the corneal thickness of normal eye – corneal thickness of eye with Glaucoma. Corneal thickness is important because it can mask an accurate reading of eye pressure. Question: Write a report summarizing your findings When writing the report consider that medical staff estimate that a difference of 4.5 microns or more could impact on their ability to interpret eye pressure correctly.arrow_forward
arrow_back_ios
SEE MORE QUESTIONS
arrow_forward_ios
Recommended textbooks for you
 Glencoe Algebra 1, Student Edition, 9780079039897...AlgebraISBN:9780079039897Author:CarterPublisher:McGraw Hill
 Big Ideas Math A Bridge To Success Algebra 1: Stu...AlgebraISBN:9781680331141Author:HOUGHTON MIFFLIN HARCOURTPublisher:Houghton Mifflin Harcourt
 College Algebra (MindTap Course List)AlgebraISBN:9781305652231Author:R. David Gustafson, Jeff HughesPublisher:Cengage Learning
 Holt Mcdougal Larson Pre-algebra: Student Edition...AlgebraISBN:9780547587776Author:HOLT MCDOUGALPublisher:HOLT MCDOUGAL
Glencoe Algebra 1, Student Edition, 9780079039897...
Algebra
ISBN:9780079039897
Author:Carter
Publisher:McGraw Hill
Big Ideas Math A Bridge To Success Algebra 1: Stu...
Algebra
ISBN:9781680331141
Author:HOUGHTON MIFFLIN HARCOURT
Publisher:Houghton Mifflin Harcourt
College Algebra (MindTap Course List)
Algebra
ISBN:9781305652231
Author:R. David Gustafson, Jeff Hughes
Publisher:Cengage Learning
Holt Mcdougal Larson Pre-algebra: Student Edition...
Algebra
ISBN:9780547587776
Author:HOLT MCDOUGAL
Publisher:HOLT MCDOUGAL
Correlation Vs Regression: Difference Between them with definition & Comparison Chart; Author: Key Differences;https://www.youtube.com/watch?v=Ou2QGSJVd0U;License: Standard YouTube License, CC-BY
Correlation and Regression: Concepts with Illustrative examples; Author: LEARN & APPLY : Lean and Six Sigma;https://www.youtube.com/watch?v=xTpHD5WLuoA;License: Standard YouTube License, CC-BY