
Videos
(a)
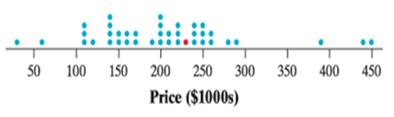
To find: the percentile of the house indicated in red on the dot plot.
(a)
Answer to Problem T2.11SPT
65th percentile
Explanation of Solution
Given:
Formula used:
Calculation:
By seeing the dot plot, it is observed that 26 of the 40 dots to the left of the red dot and therefore 26 of the 40 house in the sample have a price below $234000 which is the certain value associating to the red dot.
The percentile is the number of data values that are less than the individual’s data value divided by the number of data values in total
Therefore the percentile associating with the red dot is the 65th percentile
(b)
To Calculate: and interpret the standardized score for the house indicated by the red dot, which sold for $234000
(b)
Answer to Problem T2.11SPT
The sold price of $234000 for the house is 0.35 standard deviations above the mean sold price of $203388.
Explanation of Solution
Given:
Formula used:
Calculation:
The z-score indicating that the number of standard deviation that a value forms the mean, while a negative z-score means that the value is below the mean and a positive z-score means that the value is above the mean.
The sold price of $234000 for the house is 0.35 standard deviations above the mean sold price of $203388.
Chapter 2 Solutions
PRACTICE OF STATISTICS F/AP EXAM
Additional Math Textbook Solutions
Essentials of Statistics, Books a la Carte Edition (5th Edition)
Statistics for Psychology
Introductory Statistics (10th Edition)
Introductory Statistics
Basic Business Statistics, Student Value Edition (13th Edition)


 MATLAB: An Introduction with ApplicationsStatisticsISBN:9781119256830Author:Amos GilatPublisher:John Wiley & Sons Inc
 Probability and Statistics for Engineering and th...StatisticsISBN:9781305251809Author:Jay L. DevorePublisher:Cengage Learning
 Statistics for The Behavioral Sciences (MindTap C...StatisticsISBN:9781305504912Author:Frederick J Gravetter, Larry B. WallnauPublisher:Cengage Learning
 Elementary Statistics: Picturing the World (7th E...StatisticsISBN:9780134683416Author:Ron Larson, Betsy FarberPublisher:PEARSON
 The Basic Practice of StatisticsStatisticsISBN:9781319042578Author:David S. Moore, William I. Notz, Michael A. FlignerPublisher:W. H. Freeman
 Introduction to the Practice of StatisticsStatisticsISBN:9781319013387Author:David S. Moore, George P. McCabe, Bruce A. CraigPublisher:W. H. Freeman