
Videos
a.
To find: The
a.
Explanation of Solution
Given:
The plot is:
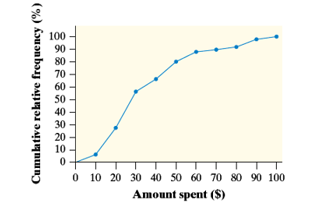
From the provided plot, the third
Thus, the interquartile
Thus, the required value is 28.
b.
To find: The percentile for the shopper.
b.
Answer to Problem 12E
The percentile is 25.
Explanation of Solution
It has been provided that the amount spent by the shopper is $19.50. To find the percentile, construct a vertical line that cuts the x -axis at 19.50. Now, construct a horizontal line for the intersection of the vertical line.
It could be seen that both the line intersecting at 25th percentile.
Thus, the required percentile is 25.
c.
To explain: The reason of curve being flat between $10 and $30.
c.
Explanation of Solution
Here, the cumulative relative frequency is increasing between the values
Chapter 2 Solutions
PRACTICE OF STATISTICS F/AP EXAM
Additional Math Textbook Solutions
Intro Stats
Statistics for Business and Economics (13th Edition)
Elementary Statistics Using Excel (6th Edition)
An Introduction to Mathematical Statistics and Its Applications (6th Edition)
Essentials of Statistics, Books a la Carte Edition (5th Edition)
Introductory Statistics (10th Edition)


 MATLAB: An Introduction with ApplicationsStatisticsISBN:9781119256830Author:Amos GilatPublisher:John Wiley & Sons Inc
 Probability and Statistics for Engineering and th...StatisticsISBN:9781305251809Author:Jay L. DevorePublisher:Cengage Learning
 Statistics for The Behavioral Sciences (MindTap C...StatisticsISBN:9781305504912Author:Frederick J Gravetter, Larry B. WallnauPublisher:Cengage Learning
 Elementary Statistics: Picturing the World (7th E...StatisticsISBN:9780134683416Author:Ron Larson, Betsy FarberPublisher:PEARSON
 The Basic Practice of StatisticsStatisticsISBN:9781319042578Author:David S. Moore, William I. Notz, Michael A. FlignerPublisher:W. H. Freeman
 Introduction to the Practice of StatisticsStatisticsISBN:9781319013387Author:David S. Moore, George P. McCabe, Bruce A. CraigPublisher:W. H. Freeman