
Videos
(a)
Percentage of the players with 100 plate appearances and batting averages of 0.363 and more.
(a)
Answer to Problem 52E
0.15% of the Major League Basketball players with 100 plate appearances had batting averages of 0.363 and higher.
Explanation of Solution
Given information:
Mean,
Standard deviation,
According to 68 − 95 − 99.7 rule:
68% of the data of a
95% of the data of a normal distribution lies with 2 standard deviation from the mean.
99.7% of the data of a normal distribution lies with 1 standard deviation from the mean.
Then
The general Normal density graph is represented as:
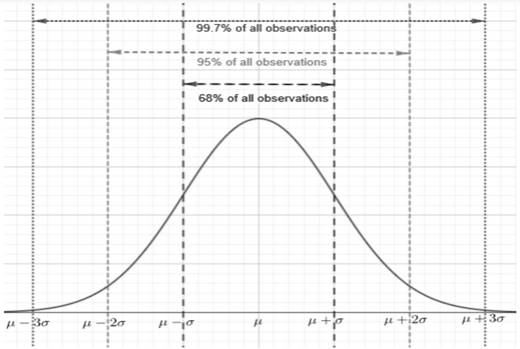
Note that
0.363 lies
According to 68 − 95 − 99.7 rule:
99.7% of the data values lie within
Although,
Data values in total are 100%.
Then
0.30% of the data values lie more than
We also know that
Normal distribution is symmetric about the mean.
That implies
0.15% of the data values are more than
And
0.15% of the data values are more than
Therefore,
0.15% of the Major League Basketball players with 100 plate appearances had batting averages of 0.363 and higher.
(b)
Percentile of the player in the distribution with batting average of 0.227.
(b)
Answer to Problem 52E
The player with batting average of 0.227 is at 16th percentile.
Explanation of Solution
Given information:
Mean,
Standard deviation,
According to 68 − 95 − 99.7 rule:
68% of the data of a normal distribution lies with 1 standard deviation from the mean.
95% of the data of a normal distribution lies with 2 standard deviation from the mean.
99.7% of the data of a normal distribution lies with 1 standard deviation from the mean.
Then
The general Normal density graph is represented as:
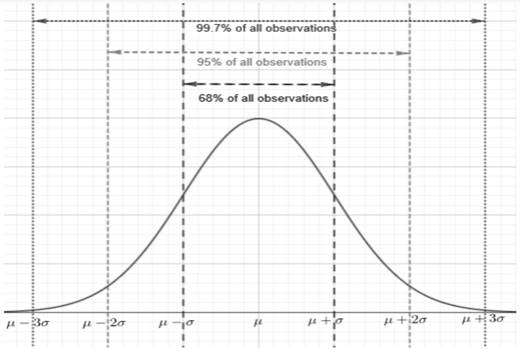
Note that
0.227 lies
According to 68 − 95 − 99.7 rule:
68% of the data values lie within
Although,
Data values in total are 100%.
Then
32% of the data values lie more than
We also know that
Normal distribution is symmetric about the mean.
That implies
16% of the data values are more than
And
16% of the data values are more than
The data value represented by the xth percentile includes x% of the data values below it.
That implies
16% of the players have batting average of 0.227 or less.
Thus,
The player with batting average of 0.227 is at 16th percentile.
Chapter 2 Solutions
PRACTICE OF STATISTICS F/AP EXAM
Additional Math Textbook Solutions
Statistics: The Art and Science of Learning from Data (4th Edition)
Basic Business Statistics, Student Value Edition (13th Edition)
Fundamentals of Statistics (5th Edition)
Basic Business Statistics, Student Value Edition
Statistics for Business and Economics (13th Edition)


 MATLAB: An Introduction with ApplicationsStatisticsISBN:9781119256830Author:Amos GilatPublisher:John Wiley & Sons Inc
 Probability and Statistics for Engineering and th...StatisticsISBN:9781305251809Author:Jay L. DevorePublisher:Cengage Learning
 Statistics for The Behavioral Sciences (MindTap C...StatisticsISBN:9781305504912Author:Frederick J Gravetter, Larry B. WallnauPublisher:Cengage Learning
 Elementary Statistics: Picturing the World (7th E...StatisticsISBN:9780134683416Author:Ron Larson, Betsy FarberPublisher:PEARSON
 The Basic Practice of StatisticsStatisticsISBN:9781319042578Author:David S. Moore, William I. Notz, Michael A. FlignerPublisher:W. H. Freeman
 Introduction to the Practice of StatisticsStatisticsISBN:9781319013387Author:David S. Moore, George P. McCabe, Bruce A. CraigPublisher:W. H. Freeman