
Concept explainers
Videos
(a)
Percentile for Colorado with 10.1% of the residents are aged 65 and above.
(a)
Answer to Problem 2E
Percentile for Colorado with 10.1% of the residents is 8th percentile.
Explanation of Solution
Given information:
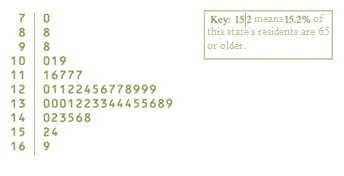
Stemplot of the percents:

Let
n , Number of data values that are less than the individual’s data value
N , Total number of data values
Now,
Write down all the data values from stemplot in ascending order:
Where,
7.0, 8.8, 9.8, 10.0, 10.1, 10.9, 11.1, 11.6, 11.7, 11.7, 11.7, 12.0, 12.1, 12.1, 12.2, 12.2, 12.4, 12.5, 12.6, 12.7, 12.7, 12.8, 12.9, 12.9, 12.9, 13.0, 13.0, 13.0, 13.1, 13.2, 13.2, 13.3, 13.3, 13.4, 13.4, 13.4, 13.5, 13.5, 13.6, 13.8, 13.9, 14.0, 14.2, 14.3, 14.5, 14.6, 14.8, 15.2, 15.4, 16.9.
Note that
4 of the 50 states have percentage below 10.1%.
Percentile can be determined as the number of data values that are less than the individual’s data value ( n ), divided by the total number of data values ( N ), written as percentage.
Thus,
Percentile that corresponds with 10.1% of the residents is 8th percentile.
(b)
Interpretation of 80th percentile and percent of Rhode Island’s residents are aged 65 and above.
(b)
Answer to Problem 2E
14% of Rhode Island’s residents are 65 or older and is at 80th percentile.
Explanation of Solution
Given information:
Stemplot of the percents:
Let
n , Number of data values that are less than the individual’s data value
N , Total number of data values
Now,
Write down all the data values from stemplot in ascending order:
Where,
7.0, 8.8, 9.8, 10.0, 10.1, 10.9, 11.1, 11.6, 11.7, 11.7, 11.7, 12.0, 12.1, 12.1, 12.2, 12.2, 12.4, 12.5, 12.6, 12.7, 12.7, 12.8, 12.9, 12.9, 12.9, 13.0, 13.0, 13.0, 13.1, 13.2, 13.2, 13.3, 13.3, 13.4, 13.4, 13.4, 13.5, 13.5, 13.6, 13.8, 13.9, 14.0, 14.2, 14.3, 14.5, 14.6, 14.8, 15.2, 15.4, 16.9.
Note that
In the sample, there are total 50 states (or 50 data values).
Such that
The data value represented by the xth percentile has x% of the data values below it.
If Rhode Island’s is at 80th percentile,
80th percentile has 80% of the data values below it.
Calculate 80% of 50 data values:
We have
40 out of 50 data values below 80th percentile.
80th percentile needs to be the 41st data value in the ascending order, and that is 14.0.
Thus,
In Rhode Island’s, 14% of residents are 65 or older and is at 80th percentile.
Chapter 2 Solutions
PRACTICE OF STATISTICS F/AP EXAM
Additional Math Textbook Solutions
Statistics: The Art and Science of Learning from Data (4th Edition)
Introductory Statistics (2nd Edition)
Essentials of Statistics (6th Edition)
Elementary Statistics (13th Edition)
Elementary Statistics: Picturing the World (7th Edition)
Introductory Statistics (10th Edition)


 MATLAB: An Introduction with ApplicationsStatisticsISBN:9781119256830Author:Amos GilatPublisher:John Wiley & Sons Inc
 Probability and Statistics for Engineering and th...StatisticsISBN:9781305251809Author:Jay L. DevorePublisher:Cengage Learning
 Statistics for The Behavioral Sciences (MindTap C...StatisticsISBN:9781305504912Author:Frederick J Gravetter, Larry B. WallnauPublisher:Cengage Learning
 Elementary Statistics: Picturing the World (7th E...StatisticsISBN:9780134683416Author:Ron Larson, Betsy FarberPublisher:PEARSON
 The Basic Practice of StatisticsStatisticsISBN:9781319042578Author:David S. Moore, William I. Notz, Michael A. FlignerPublisher:W. H. Freeman
 Introduction to the Practice of StatisticsStatisticsISBN:9781319013387Author:David S. Moore, George P. McCabe, Bruce A. CraigPublisher:W. H. Freeman