
Videos
(a)
To find: A new data set that has Internet users as users per 10,000 people and births as births per 10,000 people.
(a)
Answer to Problem 36E
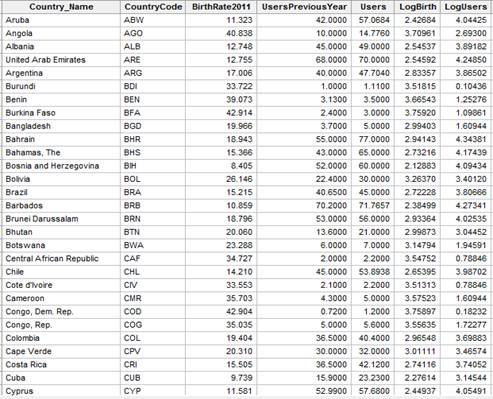
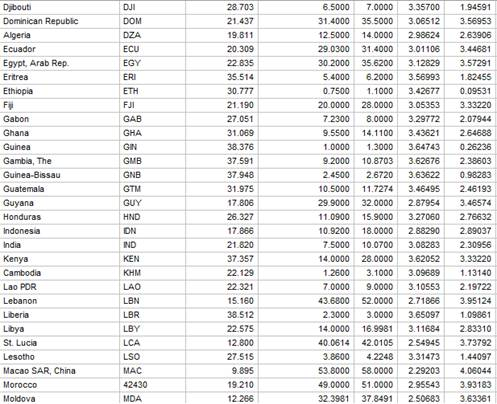
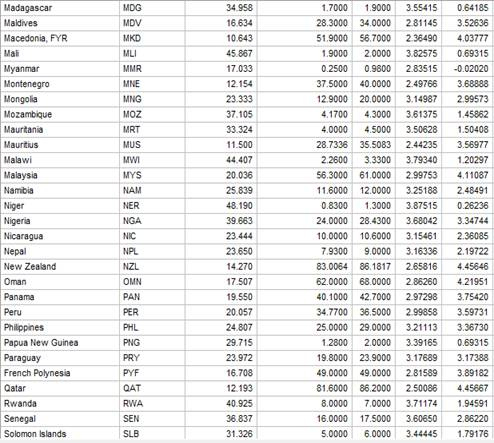
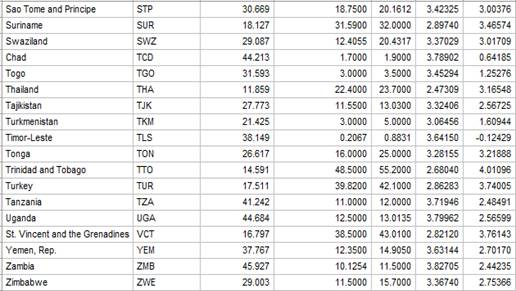
Solution: The partial data set is shown below:
Country Name |
Country Code |
Birth rate |
Users Per 100 |
Users per 10000 |
Birth per 10000 |
Aruba |
ABW |
11.323 |
57.0684 |
5706.84 |
113.23 |
Angola |
AGO |
40.838 |
14.776 |
1477.6 |
408.38 |
Albania |
ALB |
12.748 |
49.00 |
4900 |
127.48 |
United Arab Emirates |
ARE |
12.755 |
70.00 |
7000 |
127.55 |
Argentina |
ARG |
17.006 |
47.7040 |
4770.4 |
170.06 |
Burundi |
BDI |
33.722 |
1.11 |
111 |
337.22 |
Benin |
BEN |
39.073 |
3.50 |
350 |
390.73 |
Explanation of Solution
Given: The data of birthrate (births per 1000 people) versus Internet use (users per 100 people) for 106 countries is given below.
Calculation: To obtain a new data set that has Internet users as users per 10,000 people and births as births per 10,000 people use Minitab. Follow the steps below:
Step 1: Open the Minitab worksheet which contains the data.
Step 2: Go to Calc > Calculator.
Step 3: Write “Users per 10000” in the column for Store result in variable. Select Users in the column for Expression and select “&*#8221; from the calculator and write
Step 4: Click OK.
The new data set for users for 10,000 people is obtained. To obtain the new data set for Birthrate 2011 for 10,000 people follow the similar steps.
Step 1: Open the Minitab worksheet which contains the data.
Step 2: Go to Calc > Calculator.
Step 3: Write “Birth rate per 10000”in the column for Store result in variable. Select Birthrate 2011 in the column for Expression and select “&*#8221; from the calculator and write
Step 4: Click OK.
The new data set for Birthrate 2011 for 10,000 people is obtained. The partial data set is shown below:
Country Name |
Country Code |
Birth rate |
Users |
Users per 10000 |
Birth per 10000 |
Aruba |
ABW |
11.323 |
57.0684 |
5706.84 |
113.23 |
Angola |
AGO |
40.838 |
14.7760 |
1477.60 |
408.38 |
Albania |
ALB |
12.748 |
49.0000 |
4900.00 |
127.48 |
United Arab Emirates |
ARE |
12.755 |
70.0000 |
7000.00 |
127.55 |
Argentina |
ARG |
17.006 |
47.7040 |
4770.40 |
170.06 |
Burundi |
BDI |
33.722 |
1.1100 |
111.00 |
337.22 |
Benin |
BEN |
39.073 |
3.5000 |
350.00 |
390.73 |
(b)
To explain: The reason for these transformations to be linear transformations.
(b)
Answer to Problem 36E
Solution: These transformations are linear transformations because every variable is multiplied by a numerical value.
Explanation of Solution
(c)
To graph: A
(c)
Explanation of Solution
Graph: To obtain the scatterplot use Minitab. Follow the steps below:
Step 1: Go to Stat > Graph > Scatterplot > Simple.
Step 2: Select “Birth per 10,000” in Y variables and “Users per 10,000” in X variables.
Step 3: Click OK.
The required scatterplot is obtained as:
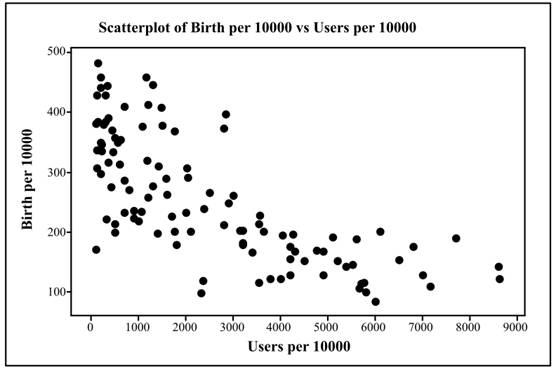
Interpretation: The scatterplot represents that the relationship between numbers of births per10,000 versus Internet users per 10,000 is negative.
(d)
To explain: The comparison between obtained scatterplot and figure 2.13.
(d)
Answer to Problem 36E
Solution: The obtained scatterplot in part (c) represents that the relationship between variables is more linear than the relationship which is represented by the scatterplot of births per 1000 people and internet users per 100 people. Both the scatterplots shows moderate relationship between the variables.
Explanation of Solution
The scatterplot of births per 1000 people and internet users per 100 people is shown below:
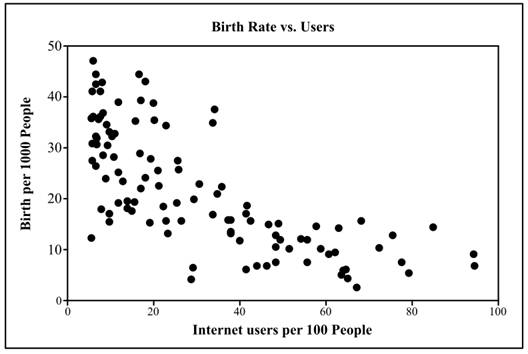
The scatterplot represents that the relationship between births per 1000 people versus Internet users per 100 people for 106 countries is quite linear and negative. The scatterplot which is obtained in part (c) represents that the relationship between birth rate per 10000 people and internet users per 10000 people is more linear than the provided scatterplot. Both the scatterplot show a moderate relationship between the variables.
(e)
To explain: The reason why World Bank selected Internet users as users per 100 people and births as births per 1000 people.
(e)
Answer to Problem 36E
Solution: To make the proper ratio, the analyst of World Bank selected Internet users as users per 100 people and births as births per 1000 people.
Explanation of Solution
Want to see more full solutions like this?
Chapter 2 Solutions
Introduction to the Practice of Statistics


 MATLAB: An Introduction with ApplicationsStatisticsISBN:9781119256830Author:Amos GilatPublisher:John Wiley & Sons Inc
 Probability and Statistics for Engineering and th...StatisticsISBN:9781305251809Author:Jay L. DevorePublisher:Cengage Learning
 Statistics for The Behavioral Sciences (MindTap C...StatisticsISBN:9781305504912Author:Frederick J Gravetter, Larry B. WallnauPublisher:Cengage Learning
 Elementary Statistics: Picturing the World (7th E...StatisticsISBN:9780134683416Author:Ron Larson, Betsy FarberPublisher:PEARSON
 The Basic Practice of StatisticsStatisticsISBN:9781319042578Author:David S. Moore, William I. Notz, Michael A. FlignerPublisher:W. H. Freeman
 Introduction to the Practice of StatisticsStatisticsISBN:9781319013387Author:David S. Moore, George P. McCabe, Bruce A. CraigPublisher:W. H. Freeman