Organic Chemistry As a Second Language: Second Semester Topics
4th Edition
ISBN: 9781119110651
Author: David R. Klein
Publisher: WILEY
expand_more
expand_more
format_list_bulleted
Concept explainers
Videos
Textbook Question
Chapter 2.3, Problem 2.5P
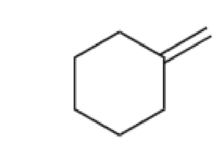
For each of the following compounds, determine whether or not you would expect its IR spectrum to exhibit a signal to the left of 3000 cm–1
Expert Solution & Answer
Want to see the full answer?
Check out a sample textbook solution
Students have asked these similar questions
For each of the following pairs of compounds, identify one IR absorption band that could be used to distinguish between them:
The H1H1 NMR spectrum shown corresponds to an unknown compound with the molecular formula C6H10C6H10. There are no strong IR bands between 2100 and 2300 or 3250 and 3350 cm−1. Deduce and draw the structure of the molecule that corresponds to the spectrum.
For each compound with formula C4H8O2, provide a brief reason why it could or could not match the IR spectrum.
Chapter 2 Solutions
Organic Chemistry As a Second Language: Second Semester Topics
Ch. 2.3 - For each of the following compounds, determine...Ch. 2.3 - For each of the following compounds, determine...Ch. 2.3 - For each of the following compounds, determine...Ch. 2.3 - For each of the following compounds, determine...Ch. 2.3 - The following compound has three carbonyl groups....Ch. 2.4 - Predict which of the following C=C bonds will...Ch. 2.4 - The C=C bond in the following compound produces an...Ch. 2.5 - For each IR spectrum below, identify whether it is...Ch. 2.5 - For each IR spectrum below, identify whether it is...Ch. 2.5 - For each IR spectrum below, identify whether it is...
Ch. 2.5 - For each IR spectrum below, identify whether it is...Ch. 2.5 - For each IR spectrum below, identify whether it is...Ch. 2.5 - For each IR spectrum below, determine whether it...Ch. 2.5 - For each IR spectrum below, determine whether it...Ch. 2.5 - For each IR spectrum below, determine whether it...Ch. 2.5 - For each IR spectrum below, determine whether it...Ch. 2.5 - For each IR spectrum below, determine whether it...Ch. 2.5 - For each IR spectrum below, determine whether it...Ch. 2.5 - For each IR spectrum below, determine whether it...Ch. 2.6 - Prob. 2.22P
Additional Science Textbook Solutions
Find more solutions based on key concepts
Rank the given solvents in decreasing order of their ability to dissolve each compound. Solutes
Organic Chemistry (9th Edition)
Q6. Express the quantity 33.2 × 10⁴ m in mm.
a) 33.2 mm
b) 3.32 mm
c) 0.332 mm
d) 3.32 × 106 mm
Chemistry: A Molecular Approach (4th Edition)
4. 38 Strontium has four naturally occurring isotopes, with mass numbers 84, 86, 87, arid 88.
a. Write the atom...
Basic Chemistry (5th Edition)
A compound that contains only C and H was burned in excess O2 to give CO2 and H2O. When 0.270 g of the compound...
General Chemistry: Atoms First
77. Write a molecular equation for the precipitation reaction that occurs (if any) when each pair of aqueous so...
Chemistry: A Molecular Approach
Explain how acids and bases suppress the ionization of water, often called the common ion effect.
Chemistry: The Molecular Nature of Matter
Knowledge Booster


Learn more about
Need a deep-dive on the concept behind this application? Look no further. Learn more about this topic, chemistry and related others by exploring similar questions and additional content below.Similar questions
- 1) Write the peak number and peak ratio by drawing the NMR spectrum of the compounds given belowa) CH3CHBrCH3b) CH3CH2CH2Iarrow_forwardAn unknown compound (x) contains only carbon and hydrogen, has MW=112 and exhibits the spectral data below. In addition to the IR signal listed below, there are only peaks corresponding to C-H stretches (between 3300 and 2900) and several in the "fingerprint region". IR (cm-1) 2145 CNMR (ppm) 77.8, 70.1, 30.2 H NMR (ppm) 2.45 (singlet)arrow_forwardWhat functional group is most likely present if a compound shows IR absorption at these frequencies? Q.) 2950 cm-1arrow_forward
- 3. Draw a molecule with the molecular formula C6H12O2 that would have the following peak(s) in its IR spectrum. (all major non-fingerprint absorbances are listed) a. 3100-3400 cm-1 (broad) 2900-3000 cm-1arrow_forwardWhat compound is represented by the following NMR spectrum? There are 5 signals in the picture I included. They are: A) 7.2 ppm, 5H, multiplet B) 4.8 ppm, 2H, singlet C) 2.6 ppm, 2H, quartet D) 1.2 ppm, 1H, singlet E) 1.1 ppm, 3H, triplet The molecular formula is C9H13Narrow_forwardIdentify the structures of isomers E and F (molecular formula C4H8O2). Relative areas are given above each signal. a.Compound E: IR absorption at 1743 cm−1b.Compound F: IR absorption at 1730 cm−1arrow_forward
- How many signals would you expect to see in the 1H NMR spectrum of each of the following compounds?arrow_forwardAt what approximate positions might the following compounds show IR absorptions?arrow_forwardFor each of the molecules in Problem 16.39, determine how many signals should appear in its 13C NMR spectrum.arrow_forward
- Identify the structures of isomers E and F (molecular formula C4H8O2).Relative areas are given above each signal.a.) Compound E: IR absorption at 1743 cm−1 b.) Compound F: IR absorption at 1730 cm−1arrow_forwardA compound displays key peaks at 1724, 1600, and 1585 cm-1 in its IR spectrum. There are also 2 peaks between 2700-2850 cm-1. The mass spectrum has a molecular ion with m/z 120. The base peak is at m/z=91. Draw a structure that best fits this data.arrow_forwardCompound 2 has molecular formula C6H12. It shows three signals in the 1H-NMR spectrum, one at 0.96 ppm, one at 2.03 ppm, and one at 5.33 ppm. The relative integrals of these three signals are 3, 2, and 1, respectively. Provide structure for compound 2, explain how you reached your conclusion.arrow_forward
arrow_back_ios
SEE MORE QUESTIONS
arrow_forward_ios
Recommended textbooks for you

 Organic Chemistry: A Guided InquiryChemistryISBN:9780618974122Author:Andrei StraumanisPublisher:Cengage Learning
Organic Chemistry: A Guided Inquiry
Chemistry
ISBN:9780618974122
Author:Andrei Straumanis
Publisher:Cengage Learning
NMR Spectroscopy; Author: Professor Dave Explains;https://www.youtube.com/watch?v=SBir5wUS3Bo;License: Standard YouTube License, CC-BY