
Introductory Statistics (10th Edition)
10th Edition
ISBN: 9780321989178
Author: Neil A. Weiss
Publisher: PEARSON
expand_more
expand_more
format_list_bulleted
Videos
Textbook Question
Chapter 2.3, Problem 98E
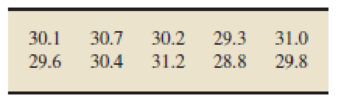
Process Capability. R. Morris and E. Watson studied various aspects of process capability in the paper “Determining Process Capability in a Chemical Batch Process” (Quality Engineering, Vol. 10(2), pp. 389–396). In one part of the study, the researchers compared the variability in product of a particular piece of equipment to a known analytic capability to decide whether product consistency could be improved. The following data were obtained for 10 batches of product.
Construct a stem-and-leaf diagram for these data with
- a. one line per stem.
- b. two lines per stem.
- c. Which stem-and-leaf diagram do you find more useful? Why?
Expert Solution & Answer
Want to see the full answer?
Check out a sample textbook solution
Students have asked these similar questions
Process Capability. R. Morris and E. Watson studied various aspects of process capability in the paper “Determining Process Capability in a Chemical Batch Process” (Quality Engineering, Vol. 10(2), pp. 389–396). In one part of the study, the researchers compared the variability in product of a particular piece of equipment to a known analytic capability to decide whether product consistency could be improved. The following data were obtained for 10 batches of product.
30.1
30.7
30.2
29.3
31.0
29.6
30.4
31.2
28.8
29.8
Construct a stem-and-leaf diagram for these data with
a. one line per stem.b. two lines per stem.c. Which stem-and-leaf diagram do you find more useful? Why?
A company institutes an exercise break for its workers to see if it will improve job satisfaction, as measured by a questionnaire that assesses workers' satisfaction before and after the implementation of the program. Using an appropriate nonparametric procedure and α=0.05, does the data indicate that that an exercise break for the workers improved job satisfaction?
Worker Number 1 2 3 4 5 6 7 8 9 10Before 36 28 30 46 26 26 24 16 15 28After 33 36 49 41 36 40 39 21 20 37
1. Using the Normal approximation, find the value of the test statistic.
2 .Find the P-value for the test statistic.
3. Choose the correct conclusion below.
A.
The after exercise program job satisfaction scores are systematically higher when compared to the before exercise program job satisfaction scores.
B.
The after exercise program job satisfaction scores seem to be systematically equal when compared to the…
Reviewers from the Oregon Evidence-Based Practice Center at the Oregon Health and Science University investigated the effectiveness of prescription drugs in assisting people to fall asleep and stay asleep (source: S. Carson, M.S. McDonagh, et al., “Drug class review: Newer drugs for insomnia,” Oregon Health and Science University, 2008, http://www.ncbi.nlm.nih.gov). Suppose a study of two drugs, Sonata and Ambien, was conducted and the resulting data are contained in a file titled Shuteye. The samples reflect an experiment in which individuals were randomly given the two brands of pills on separate evenings. Their time spent sleeping was recorded for each of the brands of sleeping pills.
(A) Does the experiment seem to have dependent or independent samples? Explain your reasoning.
(B) Do the data indicate that there is a statistical difference in the mean time spent sleeping for people using the two drugs? Test using alpha = 0.02. Conduct a statistical procedure to determine this.
(C)…
Chapter 2 Solutions
Introductory Statistics (10th Edition)
Ch. 2.1 - Give an example, other than those presented in...Ch. 2.1 - Explain the meaning of a. qualitative variable. b....Ch. 2.1 - Explain the meaning of a. qualitative data. b....Ch. 2.1 - Provide a reason why the classification of data is...Ch. 2.1 - Of the variables you have studied so far, which...Ch. 2.1 - For each part of Exercises 2.62.11, classify the...Ch. 2.1 - Earthquakes. The U.S. Geological Survey monitors...Ch. 2.1 - Top 10 IPOs. An online article from the Washington...Ch. 2.1 - Earnings from the Crypt. On the Celebrity NetWorth...Ch. 2.1 - World University Rankings. The Times Higher...
Ch. 2.1 - Recording Industry Statistics. The Recording...Ch. 2.1 - RBI Kings. As reported on MLB.com, the five...Ch. 2.1 - Top Broadcast Shows. As reported in Primetime...Ch. 2.1 - The Fulbright Program. The U.S. governments...Ch. 2.1 - Top 10 Green Cars. The following table presents...Ch. 2.1 - Ordinal Data. Another important type of data is...Ch. 2.2 - What is a frequency distribution of qualitative...Ch. 2.2 - Explain the difference between a. frequency and...Ch. 2.2 - Answer true or false to each of the statements in...Ch. 2.2 - In Exercises 2.202.25, we have presented some...Ch. 2.2 - Prob. 21ECh. 2.2 - In Exercises 2.202.25, we have presented some...Ch. 2.2 - Prob. 23ECh. 2.2 - In Exercises 2.202.25, we have presented some...Ch. 2.2 - In Exercises 2.202.25, we have presented some...Ch. 2.2 - For each data set in Exercises 2.262.31, a....Ch. 2.2 - For each data set in Exercises 2.262.31, a....Ch. 2.2 - For each data set in Exercises 2.262.31, a....Ch. 2.2 - For each data set in Exercises 2.262.31, a....Ch. 2.2 - For each data set in Exercises 2.262.31, a....Ch. 2.2 - For each data set in Exercises 2.262.31, a....Ch. 2.2 - In each of Exercises 2.322.37, we have presented a...Ch. 2.2 - In each of Exercises 2.322.37, we have presented a...Ch. 2.2 - In each of Exercises 2.322.37, we have presented a...Ch. 2.2 - In each of Exercises 2.322.37, we have presented a...Ch. 2.2 - In each of Exercises 2.322.37, we have presented a...Ch. 2.2 - Prob. 37ECh. 2.2 - Health Status. The National Center for Health...Ch. 2.2 - In Exercises 2.392.41, use the technology of your...Ch. 2.2 - Prob. 40ECh. 2.2 - In Exercises 2.392.41, use the technology of your...Ch. 2.3 - Identify an important reason for grouping data.Ch. 2.3 - Do the concepts of class limits, marks, cutpoints,...Ch. 2.3 - State three of the most important guidelines in...Ch. 2.3 - With regard to grouping quantitative data into...Ch. 2.3 - For quantitative data, we examined three types of...Ch. 2.3 - We used slightly different methods for determining...Ch. 2.3 - Explain the difference between a frequency...Ch. 2.3 - Explain the advantages and disadvantages of...Ch. 2.3 - For data that are grouped in classes based on more...Ch. 2.3 - Discuss the relative advantages and disadvantages...Ch. 2.3 - Suppose that you have a data set that contains a...Ch. 2.3 - Suppose that you have constructed a stem-and-leaf...Ch. 2.3 - In each of Exercises 2.542.59, we have presented a...Ch. 2.3 - In each of Exercises 2.542.59, we have presented a...Ch. 2.3 - In each of Exercises 2.542.59, we have presented a...Ch. 2.3 - In each of Exercises 2.542.59, we have presented a...Ch. 2.3 - Prob. 58ECh. 2.3 - In each of Exercises 2.542.59, we have presented a...Ch. 2.3 - Prob. 60ECh. 2.3 - Prob. 61ECh. 2.3 - In Exercises 2.602.71, we have presented some...Ch. 2.3 - In Exercises 2.602.71, we have presented some...Ch. 2.3 - In Exercises 2.602.71, we have presented some...Ch. 2.3 - In Exercises 2.602.71, we have presented some...Ch. 2.3 - Prob. 66ECh. 2.3 - In Exercises 2.602.71, we have presented some...Ch. 2.3 - In Exercises 2.602.71, we have presented some...Ch. 2.3 - Prob. 69ECh. 2.3 - In Exercises 2.602.71, we have presented some...Ch. 2.3 - In Exercises 2.602.71, we have presented some...Ch. 2.3 - Prob. 72ECh. 2.3 - In each of Exercises 2.722.75, construct a dotplot...Ch. 2.3 - Prob. 74ECh. 2.3 - In each of Exercises 2.722.75, construct a dotplot...Ch. 2.3 - In each of Exercises 2.762.79, construct a...Ch. 2.3 - Prob. 77ECh. 2.3 - In each of Exercises 2.762.79, construct a...Ch. 2.3 - Prob. 79ECh. 2.3 - Prob. 80ECh. 2.3 - For each data set in Exercises 2.802.91, use the...Ch. 2.3 - For each data set in Exercises 2.802.91, use the...Ch. 2.3 - For each data set in Exercises 2.802.91, use the...Ch. 2.3 - For each data set in Exercises 2.802.91, use the...Ch. 2.3 - For each data set in Exercises 2.802.91, use the...Ch. 2.3 - For each data set in Exercises 2.802.91, use the...Ch. 2.3 - Prob. 87ECh. 2.3 - Prob. 88ECh. 2.3 - Prob. 89ECh. 2.3 - Prob. 90ECh. 2.3 - Prob. 91ECh. 2.3 - Prob. 92ECh. 2.3 - Age of Passenger Cars. According to R. L. Polk ...Ch. 2.3 - Stressed-Out Bus Drivers. Frustrated passengers,...Ch. 2.3 - Acute Postoperative Days. Several neurosurgeons...Ch. 2.3 - MMs. In the article Sweetening StatisticsWhat MMs...Ch. 2.3 - Women in the Workforce. In an issue of Science...Ch. 2.3 - Process Capability. R. Morris and E. Watson...Ch. 2.3 - University Patents. The number of patents a...Ch. 2.3 - Prob. 100ECh. 2.3 - Prob. 101ECh. 2.3 - Adjusted Gross Incomes. The Internal Revenue...Ch. 2.3 - Cholesterol Levels. According to the National...Ch. 2.3 - Hospital Beds. The number of hospital beds...Ch. 2.3 - Parkinsons Disease. Parkinsons disease affects...Ch. 2.3 - The Great White Shark. In an article titled Great...Ch. 2.3 - The Beatles. In the article, Length of The Beatles...Ch. 2.3 - High School Completion. As reported by the U.S....Ch. 2.3 - Prob. 109ECh. 2.3 - Body Temperature. A study by researchers at the...Ch. 2.3 - Exam Scores. The exam scores for the students in...Ch. 2.3 - Prob. 112ECh. 2.3 - Prob. 113ECh. 2.3 - Age and Gender. The following bivariate data on...Ch. 2.3 - Prob. 115ECh. 2.3 - Clocking the Cheetah. Construct a...Ch. 2.3 - Prob. 117ECh. 2.3 - Residential Energy Consumption. Refer to the...Ch. 2.3 - Prob. 119ECh. 2.3 - Cardiovascular Hospitalizations. The Florida State...Ch. 2.3 - Prob. 121ECh. 2.4 - In each of Exercises 2.1222.127, explain the...Ch. 2.4 - In each of Exercises 2.1222.127, explain the...Ch. 2.4 - In each of Exercises 2.1222.127, explain the...Ch. 2.4 - Prob. 125ECh. 2.4 - Prob. 126ECh. 2.4 - Prob. 127ECh. 2.4 - Prob. 128ECh. 2.4 - Suppose that a variable of a population has a...Ch. 2.4 - Prob. 130ECh. 2.4 - Identify and sketch three distribution shapes that...Ch. 2.4 - Prob. 132ECh. 2.4 - In each of Exercises 2.1322.139, we have drawn a...Ch. 2.4 - In each of Exercises 2.1322.139, we have drawn a...Ch. 2.4 - In each of Exercises 2.1322.139, we have drawn a...Ch. 2.4 - In each of Exercises 2.1322.139, we have drawn a...Ch. 2.4 - In each of Exercises 2.1322.139, we have drawn a...Ch. 2.4 - In each of Exercises 2.1322.139, we have drawn a...Ch. 2.4 - Prob. 139ECh. 2.4 - In each of Exercises 2.1402.149, we have provided...Ch. 2.4 - In each of Exercises 2.1402.149, we have provided...Ch. 2.4 - Prob. 142ECh. 2.4 - In each of Exercises 2.1402.149, we have provided...Ch. 2.4 - In each of Exercises 2.1402.149, we have provided...Ch. 2.4 - In each of Exercises 2.1402.149, we have provided...Ch. 2.4 - In each of Exercises 2.1402.149, we have provided...Ch. 2.4 - Prob. 147ECh. 2.4 - Prob. 148ECh. 2.4 - Prob. 149ECh. 2.4 - Old Faithful. Old Faithful is a geyser in...Ch. 2.4 - SnowGoose Nests. In the article Trophic...Ch. 2.4 - Prob. 152ECh. 2.4 - In each of Exercises 2.1522.157, a. use the...Ch. 2.4 - In each of Exercises 2.1522.157, a. use the...Ch. 2.4 - Prob. 155ECh. 2.4 - In each of Exercises 2.1522.157, a. use the...Ch. 2.4 - In each of Exercises 2.1522.157, a. use the...Ch. 2.4 - Standard Normal Distribution. One of the most...Ch. 2.5 - Give one reason why constructing and reading...Ch. 2.5 - Prob. 163ECh. 2.5 - Reading Skills. Each year the director of the...Ch. 2.5 - Americas Melting Pot. The U.S. Census Bureau...Ch. 2.5 - Prob. 167ECh. 2.5 - Drunk-Driving Fatalities. Drunk-driving fatalities...Ch. 2.5 - Prob. 169ECh. 2.5 - Prob. 170ECh. 2.5 - Prob. 171ECh. 2 - This problem is about variables. a. What is a...Ch. 2 - This problem is about data. a. What are data? b....Ch. 2 - For a qualitative data set, what is a a. frequency...Ch. 2 - What is the relationship between a frequency or...Ch. 2 - Identify two main types of graphical displays that...Ch. 2 - In a bar chart, unlike in a histogram, the bars do...Ch. 2 - Some users of statistics prefer pie charts to bar...Ch. 2 - When is the use of single-value grouping...Ch. 2 - A quantitative data set has been grouped by using...Ch. 2 - A quantitative data set has been grouped by using...Ch. 2 - A quantitative data set has been grouped by using...Ch. 2 - A quantitative data set has been grouped by using...Ch. 2 - Explain the relative positioning of the bars in a...Ch. 2 - Sketch the curve corresponding to each of the...Ch. 2 - Draw a smooth curve that represents a symmetric...Ch. 2 - Prob. 16RPCh. 2 - Largest Hydroelectric Plants. According to...Ch. 2 - DVD Players. Refer to Example 2.16 on page 60. a....Ch. 2 - Inauguration Ages. From the Information Please...Ch. 2 - Inauguration Ages. Refer to Problem 19. Construct...Ch. 2 - Prob. 21RPCh. 2 - Prob. 22RPCh. 2 - Busy Bank Tellers. The Prescott National Bank has...Ch. 2 - On-Time Arrivals. The Air Travel Consumer Report...Ch. 2 - Old Ballplayers. From the ESPN Web site, we...Ch. 2 - Prob. 26RPCh. 2 - U.S. Divisions. The U.S. Census Bureau divides the...Ch. 2 - Prob. 28RPCh. 2 - Prob. 29RPCh. 2 - Hair and Eye Color. In the article Graphical...Ch. 2 - Prob. 31RPCh. 2 - In Problems 3133, a. identify the population and...Ch. 2 - In Problems 3133, a. identify the population and...Ch. 2 - UWEC UNDERGRADUATES Recall from Chapter 1 (see...Ch. 2 - Recall that, each year, Forbes magazine publishes...
Knowledge Booster


Learn more about
Need a deep-dive on the concept behind this application? Look no further. Learn more about this topic, statistics and related others by exploring similar questions and additional content below.Similar questions
- Urban Travel Times Population of cities and driving times are related, as shown in the accompanying table, which shows the 1960 population N, in thousands, for several cities, together with the average time T, in minutes, sent by residents driving to work. City Population N Driving time T Los Angeles 6489 16.8 Pittsburgh 1804 12.6 Washington 1808 14.3 Hutchinson 38 6.1 Nashville 347 10.8 Tallahassee 48 7.3 An analysis of these data, along with data from 17 other cities in the United States and Canada, led to a power model of average driving time as a function of population. a Construct a power model of driving time in minutes as a function of population measured in thousands b Is average driving time in Pittsburgh more or less than would be expected from its population? c If you wish to move to a smaller city to reduce your average driving time to work by 25, how much smaller should the city be?arrow_forwardSuppose that, as part of a research methods class, Bailey was asked to write a summary of a research paper on the topic of the effects of oil contamination in soil on seed germination rates. Identify the explanatory and the response variables.arrow_forwardIn the book Business Research Methods (5th ed.), Donald R. Cooper and C. William Emory discuss studying the relationship between on-the-job accidents and smoking. Cooper and Emory describe the study as follows: Suppose a manager implementing a smoke-free workplace policy is interested in whether smoking affects worker accidents. Since the company has complete reports of on-the-job accidents, she draws a sample of names of workers who were involved in accidents during the last year. A similar sample from among workers who had no reported accidents in the last year is drawn. She interviews members of both groups to determine if they are smokers or not. The sample results are given in the following table. On-the-Job Accident Smoker Yes No Row Total Heavy 12 5 17 Moderate 9 10 19 Nonsmoker 13 17 30 Column total 34 32 66 Expected counts are below observed counts Accident No Accident Total Heavy 12 5 17 8.76 8.24…arrow_forward
- A statistical program is recommended. Jensen Tire & Auto is in the process of deciding whether to purchase a maintenance contract for its new computer wheel alignment and balancing machine. Managers feel that maintenance expense should be related to usage, and they collected the following information on weekly usage (hours) and annual maintenance expense (in hundreds of dollars). Weekly Usage(hours) AnnualMaintenanceExpense 13 17.0 10 22.0 20 30.0 28 37.0 32 47.0 17 30.5 24 32.5 31 39.0 40 51.5 38 40.0 #1) Develop the estimated regression equation that could be used to predict the annual maintenance expense (in hundreds of dollars) given the weekly usage (in hours). (Round your numerical values to two decimal places.) #2) The expected expense of a machine being used 34 hours per week is $ hundred.arrow_forwardAn automotive engineer is investigating two different types of metering devices for an electronic fuel injection system to determine whether they differ in their fuel mileage performance. The system is installed on 10 different cars, and a test is run with each metering device on each car. The data is provided below: Metering Device Car 1 2 1 17.6 16.8 2 19.4 20.0 3 18.2 17.6 4 17.1 16.4 5 15.3 16.0 6 15.9 15.9 7 16.3 16.5 8 18.0 18.4 9 17.3 16.4 10 19.1 20.1 Is there a significant difference between the means of the two metering devices? Use . Interpret the result in the context of the problem. An article in the journal Hazardous Waste and Hazardous Materials (Vol. 6, 1989) reported the results of an analysis of the weight of calcium in standard cement and cement doped with lead. Reduced levels of calcium would indicate that the hydration mechanism in the cement is blocked…arrow_forwardA paper investigated the driving behavior of teenagers by observing their vehicles as they left a high school parking lot and then again at a site approximately 1 2 mile from the school. Assume that it is reasonable to regard the teen drivers in this study as representative of the population of teen drivers. MaleDriver FemaleDriver 1.3 -0.3 1.3 0.6 0.9 1.1 2.1 0.7 0.7 1.1 1.3 1.2 3 0.1 1.3 0.9 0.6 0.5 2.1 0.5 (a) Use a .01 level of significance for any hypothesis tests. Data consistent with summary quantities appearing in the paper are given in the table. The measurements represent the difference between the observed vehicle speed and the posted speed limit (in miles per hour) for a sample of male teenage drivers and a sample of female teenage drivers. (Use ?males − ?females. Round your test statistic to two decimal places. Round your degrees of freedom down to the nearest whole number. Round your p-value to three decimal places.) t = df =…arrow_forward
- A paper investigated the driving behavior of teenagers by observing their vehicles as they left a high school parking lot and then again at a site approximately 1 2 mile from the school. Assume that it is reasonable to regard the teen drivers in this study as representative of the population of teen drivers. MaleDriver FemaleDriver 1.4 -0.2 1.2 0.5 0.9 1.1 2.1 0.7 0.7 1.1 1.3 1.2 3 0.1 1.3 0.9 0.6 0.5 2.1 0.5 (a) Use a .01 level of significance for any hypothesis tests. Data consistent with summary quantities appearing in the paper are given in the table. The measurements represent the difference between the observed vehicle speed and the posted speed limit (in miles per hour) for a sample of male teenage drivers and a sample of female teenage drivers. (Use ?males − ?females. Round your test statistic to two decimal places. Round your degrees of freedom down to the nearest whole number. Round your p-value to three decimal places.) t = df =…arrow_forwardThe Behavioral Risk Factor Surveillance System (BRFSS) is an annual telephone survey designed to identify risk factors in the adult population and reportemerging health trends. The following table summarizes two variables for the respondents: health status and health coverage, which describes whether each respondent had health insurance: Health Status Excellent Very Good Good Fair Poor Total Health No 459 727 854 385 99 2524 Coverage Yes 4198 6245 4821 1634 578 17476 Total 4657 6972 5675 2019 677 20000 If we draw one individual at random, what is the probability that the respondent has health coverage if they have good health? Answer with a decimal rounded to 3 decimal places.arrow_forwardNutritionResearchers compared protein intake among threegroups of postmenopausal women: (1) women eating astandard American diet (STD), (2) women eating a lactoovo-vegetarian diet (LAC), and (3) women eating a strictvegetarian diet (VEG). The mean ± 1 sd for protein intake(mg) is presented in Table 12.29. 12.5 Using the data in Table 12.29, perform a multiplecomparisons procedure to identify which specific underlyingmeans are different.arrow_forward
- A suburban hotel derives its revenue from its hotel and restaurant operations. The owners are interested in the relationship between the number of rooms occupied on a nightly basis and the revenue per day in the restaurant. Below is a sample of 25 days (Monday through Thursday) from last year showing the restaurant income and number of rooms occupied. Day Revenue Occupied Day Revenue Occupied 1 $ 1,452 23 14 $ 1,425 27 2 1,361 47 15 1,445 34 3 1,426 21 16 1,439 15 4 1,470 39 17 1,348 19 5 1,456 37 18 1,450 38 6 1,430 29 19 1,431 44 7 1,354 23 20 1,446 47 8 1,442 44 21 1,485 43 9 1,394 45 22 1,405 38 10 1,459 16 23 1,461 51 11 1,399 30 24 1,490 61 12 1,458 42 25 1,426 39 13 1,537 54 Click here for the Excel Data File Choose the…arrow_forwardJensen Tire & Auto is in the process of deciding whether to purchase a maintenance contract for its new computer wheel alignment and balancing machine. Managers feel that maintenance expense should be related to usage, and they collected the following information on weekly usage (hours) and annual maintenance expense (in hundreds of dollars). Weekly Usage(hours) AnnualMaintenanceExpense 13 17.0 10 22.0 20 30.0 28 37.0 32 47.0 17 30.5 24 32.5 31 39.0 40 51.5 38 40.0 test statistic is 6.90 Find the p-value. (Round your answer to three decimal places.) p-value = State your conclusion. Reject H0. We conclude that the relationship between weekly usage (hours) and annual maintenance expense (in hundreds of dollars) is significant. Do not reject H0. We conclude that the relationship between weekly usage (hours) and annual maintenance expense (in hundreds of dollars) is significant. Reject H0. We cannot conclude that the relationship between weekly usage…arrow_forwardThe director of admissions at a state college is interested in seeing if admissions status (admitted, waiting list, denied admission) at his college is related to the type of community (urban, rural, suburban) in which an applicant resides. Which of the following tests will be the most appropriate? Question content area bottom Part 1 A. Kruskal-Wallis rank Test B. χ2 test for independence C. Two-way ANOVA F-test for interaction effect D. Two-way ANOVA F-test for the type of community effectarrow_forward
arrow_back_ios
SEE MORE QUESTIONS
arrow_forward_ios
Recommended textbooks for you
 Functions and Change: A Modeling Approach to Coll...AlgebraISBN:9781337111348Author:Bruce Crauder, Benny Evans, Alan NoellPublisher:Cengage Learning
 Glencoe Algebra 1, Student Edition, 9780079039897...AlgebraISBN:9780079039897Author:CarterPublisher:McGraw Hill
Functions and Change: A Modeling Approach to Coll...
Algebra
ISBN:9781337111348
Author:Bruce Crauder, Benny Evans, Alan Noell
Publisher:Cengage Learning
Glencoe Algebra 1, Student Edition, 9780079039897...
Algebra
ISBN:9780079039897
Author:Carter
Publisher:McGraw Hill
F- Test or F- statistic (F- Test of Equality of Variance); Author: Prof. Arvind Kumar Sing;https://www.youtube.com/watch?v=PdUt7InTyc8;License: Standard Youtube License
Statistics 101: F-ratio Test for Two Equal Variances; Author: Brandon Foltz;https://www.youtube.com/watch?v=UWQO4gX7-lE;License: Standard YouTube License, CC-BY
Hypothesis Testing and Confidence Intervals (FRM Part 1 – Book 2 – Chapter 5); Author: Analystprep;https://www.youtube.com/watch?v=vth3yZIUlGQ;License: Standard YouTube License, CC-BY
Understanding the Levene's Test for Equality of Variances in SPSS; Author: Dr. Todd Grande;https://www.youtube.com/watch?v=udJr8V2P8Xo;License: Standard Youtube License