
Introductory Statistics (10th Edition)
10th Edition
ISBN: 9780321989178
Author: Neil A. Weiss
Publisher: PEARSON
expand_more
expand_more
format_list_bulleted
Concept explainers
Videos
Textbook Question
Chapter 2.5, Problem 165E
Reading Skills. Each year the director of the reading program in a school district administers a standard test of reading skills. Then the director compares the average score for his district with the national average. Figure 2.20 was presented to the school board in the year 2013.
FIGURE 2.20 Average reading scores
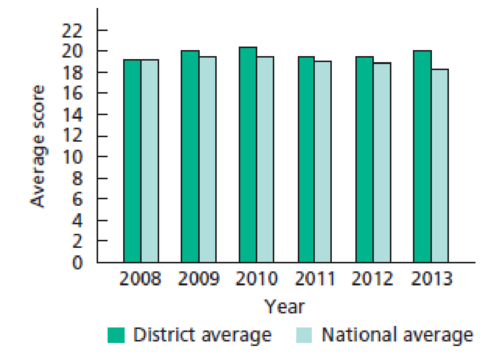
- a. Obtain a truncated version of Fig. 2.20 by sliding a piece of paper over the bottom of the graph so that the bars start at 16.
- b. Repeat part (a), but have the bars start at 18.
- c. What misleading impression about the year 2013 scores is given by the truncated graphs obtained in parts (a) and (b)?
Expert Solution & Answer
Want to see the full answer?
Check out a sample textbook solution
Students have asked these similar questions
Reading Skills. Each year the director of the reading program in a school district administers a standard test of reading skills. Then the director compares the average score for his district with the national average. Figure 2.20 was presented to the school board in the year 2013.
FIGURE Average reading scores
a. Obtain a truncated version of Fig. by sliding a piece of paper over the bottom of the graph so that the bars start at 16.
b. Repeat part (a), but have the bars start at 18.
c. What misleading impression about the year 2013 scores is given by the truncated graphs obtained in parts (a) and (b)?
#3
(A)-Write a model for the data in the form of either y=k+Asin(B(x−h)) or y=k+Acos(B(x−h)).
(B)-Plot your model from number 3A with the year listed along the horizontal axis and the sunspot number along the vertical axis. How does this compare to the graph of the actual data?
(C)-According to your model, what is the length of the sunspot cycle in years? Explain?
(D)-Use your model to predict the sunspot number for 2001. How does your prediction compare with the actual value of 111.
The graph shows the percentage of citizens of a certain country who trust in their government. Complete parts a through c below.
Chapter 2 Solutions
Introductory Statistics (10th Edition)
Ch. 2.1 - Give an example, other than those presented in...Ch. 2.1 - Explain the meaning of a. qualitative variable. b....Ch. 2.1 - Explain the meaning of a. qualitative data. b....Ch. 2.1 - Provide a reason why the classification of data is...Ch. 2.1 - Of the variables you have studied so far, which...Ch. 2.1 - For each part of Exercises 2.62.11, classify the...Ch. 2.1 - Earthquakes. The U.S. Geological Survey monitors...Ch. 2.1 - Top 10 IPOs. An online article from the Washington...Ch. 2.1 - Earnings from the Crypt. On the Celebrity NetWorth...Ch. 2.1 - World University Rankings. The Times Higher...
Ch. 2.1 - Recording Industry Statistics. The Recording...Ch. 2.1 - RBI Kings. As reported on MLB.com, the five...Ch. 2.1 - Top Broadcast Shows. As reported in Primetime...Ch. 2.1 - The Fulbright Program. The U.S. governments...Ch. 2.1 - Top 10 Green Cars. The following table presents...Ch. 2.1 - Ordinal Data. Another important type of data is...Ch. 2.2 - What is a frequency distribution of qualitative...Ch. 2.2 - Explain the difference between a. frequency and...Ch. 2.2 - Answer true or false to each of the statements in...Ch. 2.2 - In Exercises 2.202.25, we have presented some...Ch. 2.2 - Prob. 21ECh. 2.2 - In Exercises 2.202.25, we have presented some...Ch. 2.2 - Prob. 23ECh. 2.2 - In Exercises 2.202.25, we have presented some...Ch. 2.2 - In Exercises 2.202.25, we have presented some...Ch. 2.2 - For each data set in Exercises 2.262.31, a....Ch. 2.2 - For each data set in Exercises 2.262.31, a....Ch. 2.2 - For each data set in Exercises 2.262.31, a....Ch. 2.2 - For each data set in Exercises 2.262.31, a....Ch. 2.2 - For each data set in Exercises 2.262.31, a....Ch. 2.2 - For each data set in Exercises 2.262.31, a....Ch. 2.2 - In each of Exercises 2.322.37, we have presented a...Ch. 2.2 - In each of Exercises 2.322.37, we have presented a...Ch. 2.2 - In each of Exercises 2.322.37, we have presented a...Ch. 2.2 - In each of Exercises 2.322.37, we have presented a...Ch. 2.2 - In each of Exercises 2.322.37, we have presented a...Ch. 2.2 - Prob. 37ECh. 2.2 - Health Status. The National Center for Health...Ch. 2.2 - In Exercises 2.392.41, use the technology of your...Ch. 2.2 - Prob. 40ECh. 2.2 - In Exercises 2.392.41, use the technology of your...Ch. 2.3 - Identify an important reason for grouping data.Ch. 2.3 - Do the concepts of class limits, marks, cutpoints,...Ch. 2.3 - State three of the most important guidelines in...Ch. 2.3 - With regard to grouping quantitative data into...Ch. 2.3 - For quantitative data, we examined three types of...Ch. 2.3 - We used slightly different methods for determining...Ch. 2.3 - Explain the difference between a frequency...Ch. 2.3 - Explain the advantages and disadvantages of...Ch. 2.3 - For data that are grouped in classes based on more...Ch. 2.3 - Discuss the relative advantages and disadvantages...Ch. 2.3 - Suppose that you have a data set that contains a...Ch. 2.3 - Suppose that you have constructed a stem-and-leaf...Ch. 2.3 - In each of Exercises 2.542.59, we have presented a...Ch. 2.3 - In each of Exercises 2.542.59, we have presented a...Ch. 2.3 - In each of Exercises 2.542.59, we have presented a...Ch. 2.3 - In each of Exercises 2.542.59, we have presented a...Ch. 2.3 - Prob. 58ECh. 2.3 - In each of Exercises 2.542.59, we have presented a...Ch. 2.3 - Prob. 60ECh. 2.3 - Prob. 61ECh. 2.3 - In Exercises 2.602.71, we have presented some...Ch. 2.3 - In Exercises 2.602.71, we have presented some...Ch. 2.3 - In Exercises 2.602.71, we have presented some...Ch. 2.3 - In Exercises 2.602.71, we have presented some...Ch. 2.3 - Prob. 66ECh. 2.3 - In Exercises 2.602.71, we have presented some...Ch. 2.3 - In Exercises 2.602.71, we have presented some...Ch. 2.3 - Prob. 69ECh. 2.3 - In Exercises 2.602.71, we have presented some...Ch. 2.3 - In Exercises 2.602.71, we have presented some...Ch. 2.3 - Prob. 72ECh. 2.3 - In each of Exercises 2.722.75, construct a dotplot...Ch. 2.3 - Prob. 74ECh. 2.3 - In each of Exercises 2.722.75, construct a dotplot...Ch. 2.3 - In each of Exercises 2.762.79, construct a...Ch. 2.3 - Prob. 77ECh. 2.3 - In each of Exercises 2.762.79, construct a...Ch. 2.3 - Prob. 79ECh. 2.3 - Prob. 80ECh. 2.3 - For each data set in Exercises 2.802.91, use the...Ch. 2.3 - For each data set in Exercises 2.802.91, use the...Ch. 2.3 - For each data set in Exercises 2.802.91, use the...Ch. 2.3 - For each data set in Exercises 2.802.91, use the...Ch. 2.3 - For each data set in Exercises 2.802.91, use the...Ch. 2.3 - For each data set in Exercises 2.802.91, use the...Ch. 2.3 - Prob. 87ECh. 2.3 - Prob. 88ECh. 2.3 - Prob. 89ECh. 2.3 - Prob. 90ECh. 2.3 - Prob. 91ECh. 2.3 - Prob. 92ECh. 2.3 - Age of Passenger Cars. According to R. L. Polk ...Ch. 2.3 - Stressed-Out Bus Drivers. Frustrated passengers,...Ch. 2.3 - Acute Postoperative Days. Several neurosurgeons...Ch. 2.3 - MMs. In the article Sweetening StatisticsWhat MMs...Ch. 2.3 - Women in the Workforce. In an issue of Science...Ch. 2.3 - Process Capability. R. Morris and E. Watson...Ch. 2.3 - University Patents. The number of patents a...Ch. 2.3 - Prob. 100ECh. 2.3 - Prob. 101ECh. 2.3 - Adjusted Gross Incomes. The Internal Revenue...Ch. 2.3 - Cholesterol Levels. According to the National...Ch. 2.3 - Hospital Beds. The number of hospital beds...Ch. 2.3 - Parkinsons Disease. Parkinsons disease affects...Ch. 2.3 - The Great White Shark. In an article titled Great...Ch. 2.3 - The Beatles. In the article, Length of The Beatles...Ch. 2.3 - High School Completion. As reported by the U.S....Ch. 2.3 - Prob. 109ECh. 2.3 - Body Temperature. A study by researchers at the...Ch. 2.3 - Exam Scores. The exam scores for the students in...Ch. 2.3 - Prob. 112ECh. 2.3 - Prob. 113ECh. 2.3 - Age and Gender. The following bivariate data on...Ch. 2.3 - Prob. 115ECh. 2.3 - Clocking the Cheetah. Construct a...Ch. 2.3 - Prob. 117ECh. 2.3 - Residential Energy Consumption. Refer to the...Ch. 2.3 - Prob. 119ECh. 2.3 - Cardiovascular Hospitalizations. The Florida State...Ch. 2.3 - Prob. 121ECh. 2.4 - In each of Exercises 2.1222.127, explain the...Ch. 2.4 - In each of Exercises 2.1222.127, explain the...Ch. 2.4 - In each of Exercises 2.1222.127, explain the...Ch. 2.4 - Prob. 125ECh. 2.4 - Prob. 126ECh. 2.4 - Prob. 127ECh. 2.4 - Prob. 128ECh. 2.4 - Suppose that a variable of a population has a...Ch. 2.4 - Prob. 130ECh. 2.4 - Identify and sketch three distribution shapes that...Ch. 2.4 - Prob. 132ECh. 2.4 - In each of Exercises 2.1322.139, we have drawn a...Ch. 2.4 - In each of Exercises 2.1322.139, we have drawn a...Ch. 2.4 - In each of Exercises 2.1322.139, we have drawn a...Ch. 2.4 - In each of Exercises 2.1322.139, we have drawn a...Ch. 2.4 - In each of Exercises 2.1322.139, we have drawn a...Ch. 2.4 - In each of Exercises 2.1322.139, we have drawn a...Ch. 2.4 - Prob. 139ECh. 2.4 - In each of Exercises 2.1402.149, we have provided...Ch. 2.4 - In each of Exercises 2.1402.149, we have provided...Ch. 2.4 - Prob. 142ECh. 2.4 - In each of Exercises 2.1402.149, we have provided...Ch. 2.4 - In each of Exercises 2.1402.149, we have provided...Ch. 2.4 - In each of Exercises 2.1402.149, we have provided...Ch. 2.4 - In each of Exercises 2.1402.149, we have provided...Ch. 2.4 - Prob. 147ECh. 2.4 - Prob. 148ECh. 2.4 - Prob. 149ECh. 2.4 - Old Faithful. Old Faithful is a geyser in...Ch. 2.4 - SnowGoose Nests. In the article Trophic...Ch. 2.4 - Prob. 152ECh. 2.4 - In each of Exercises 2.1522.157, a. use the...Ch. 2.4 - In each of Exercises 2.1522.157, a. use the...Ch. 2.4 - Prob. 155ECh. 2.4 - In each of Exercises 2.1522.157, a. use the...Ch. 2.4 - In each of Exercises 2.1522.157, a. use the...Ch. 2.4 - Standard Normal Distribution. One of the most...Ch. 2.5 - Give one reason why constructing and reading...Ch. 2.5 - Prob. 163ECh. 2.5 - Reading Skills. Each year the director of the...Ch. 2.5 - Americas Melting Pot. The U.S. Census Bureau...Ch. 2.5 - Prob. 167ECh. 2.5 - Drunk-Driving Fatalities. Drunk-driving fatalities...Ch. 2.5 - Prob. 169ECh. 2.5 - Prob. 170ECh. 2.5 - Prob. 171ECh. 2 - This problem is about variables. a. What is a...Ch. 2 - This problem is about data. a. What are data? b....Ch. 2 - For a qualitative data set, what is a a. frequency...Ch. 2 - What is the relationship between a frequency or...Ch. 2 - Identify two main types of graphical displays that...Ch. 2 - In a bar chart, unlike in a histogram, the bars do...Ch. 2 - Some users of statistics prefer pie charts to bar...Ch. 2 - When is the use of single-value grouping...Ch. 2 - A quantitative data set has been grouped by using...Ch. 2 - A quantitative data set has been grouped by using...Ch. 2 - A quantitative data set has been grouped by using...Ch. 2 - A quantitative data set has been grouped by using...Ch. 2 - Explain the relative positioning of the bars in a...Ch. 2 - Sketch the curve corresponding to each of the...Ch. 2 - Draw a smooth curve that represents a symmetric...Ch. 2 - Prob. 16RPCh. 2 - Largest Hydroelectric Plants. According to...Ch. 2 - DVD Players. Refer to Example 2.16 on page 60. a....Ch. 2 - Inauguration Ages. From the Information Please...Ch. 2 - Inauguration Ages. Refer to Problem 19. Construct...Ch. 2 - Prob. 21RPCh. 2 - Prob. 22RPCh. 2 - Busy Bank Tellers. The Prescott National Bank has...Ch. 2 - On-Time Arrivals. The Air Travel Consumer Report...Ch. 2 - Old Ballplayers. From the ESPN Web site, we...Ch. 2 - Prob. 26RPCh. 2 - U.S. Divisions. The U.S. Census Bureau divides the...Ch. 2 - Prob. 28RPCh. 2 - Prob. 29RPCh. 2 - Hair and Eye Color. In the article Graphical...Ch. 2 - Prob. 31RPCh. 2 - In Problems 3133, a. identify the population and...Ch. 2 - In Problems 3133, a. identify the population and...Ch. 2 - UWEC UNDERGRADUATES Recall from Chapter 1 (see...Ch. 2 - Recall that, each year, Forbes magazine publishes...
Knowledge Booster


Learn more about
Need a deep-dive on the concept behind this application? Look no further. Learn more about this topic, statistics and related others by exploring similar questions and additional content below.Similar questions
- The diversity index, from 0 to 100, measures the chance that two randomly selected people are a different race or ethnicity. The diversity index in the United States varies widely from region to region, from as high as 81 in Hawaii to as low as 11 in Vermont. The bar graph shows the national diversity index for the United States for four years in the period from 1980 through 2010.The data in the graph can be modeled by the formulaD = 0.005x2 + 0.55x + 34,where D is the national diversity index in the United States x years after 1980. According to the formula, what was the U.S. diversity index in 2010? How does this compare with the index displayed by the bar graph?arrow_forwardUse the Massey Method with a 10 max point differential for the following system: During the Early Part of the Season: Team B beats C by 8 points. Team D beats E by 5 points. During the Middle Part of the Season: Team A beats D by 10 points. Team E beats C by 5 points. During the Later Part of the Season: Team A beats E by 4. Team E beats B by 20 points. a. Draw a directed graph of this the season. Note that this question asks you to cap the point differential. b. Write the system of equations for this season using the Massey method. c. Solve the system (using least squares) to find the ratings for each team, and use those ratings to rank them.arrow_forwardQuestion 2 Which graph has the largest value for b ? a.green b.orange c.black d.red e.blue Which graph has the smallest value for b? a.green b.orange c.black d.red e.blue which graph has the largest value for a ? a.blue b.black c.red d.green e.orangearrow_forward
- Can someone please help to make the graph and answer the question? Sample with the 1 m² and the 16 m² quadrats until you sample all seven plantspecies. 1. Record your data (see the table below), and graph your results. For 1 m² and 16 m², plot the number of quadrats on the x-axis and the cumulative number of plant species found in 1, 1+2, 1+2+3, etc., samples on the y-axis. 2. For each quadrat size, what is the minimum number of quadrats that should be made in order to sample all seven species at least once? Data for 1 m² quadrats Sample run Sample Plant 1 2 3 4 5 6 7 8 9 10 11 12 13 14 15 16 17 18 19 20 B 0 0 1 0 0 0 0 0 0 0 0 0 0 0 0 0 0 0 0 0 O 0 0 0 0 0 0 0 0 0 0 0 0 0 0 1 0 0 0 0 1 R 0 0 0 0 0 0 0 0 0 0 0 0 0 0 0 0 0 0 0 0 T 0 0 0 0 0 0 0 0 0 0 0 0 0 0 0 0 0 0 0 0 W 0 0 0 0 0 0 0 0 0 0 0 0 0 0 0 0 0 0 0 0 X 0 0 0 0 0 0 0 0 0 1 0 0 0 0 0 0 0 1 0 0 Z 1 0 0 0 0 0 0 0…arrow_forwardThis question has several parts that must be completed sequentially. If you skip a part of the question, you will not receive any points for the skipped part, and you will not be able to come back to the skipped part. Tutorial Exercise A die is a cube with dots on each face. The faces have 1, 2, 3, 4, 5, or 6 dots. The table below is a computer simulation (from the software package Minitab) of the results of rolling a fair die 20 times. DATA DISPLAY ROW C1 C2 C3 C4 C5 C6 C7 C8 C9 C10 1 3 2 4 5 4 5 3 5 3 4 2 5 2 2 2 5 3 2 3 1 4 (a) Assume that each number in the table corresponds to the number of dots on the upward face of the die. Is it appropriate that the same number appears more than once? Why?What is the outcome of the sixth roll?(b) If we simulate more rolls of the die, do you expect to get the same sequence of outcomes? Why or why not? Step 1 (a) Assume that each number in the table corresponds to the number of dots on the upward face of the die. Is it…arrow_forwardUsing the graph on the image provided, what would be the answer for the question number 4 below? 4) Imagine you are studying the effect of teaching online on job satisfaction in college professors. Are these data useful for your research purposes? Why or why not?arrow_forward
- The figure below shows a dotplot generated by Minitab for the number of licensed drivers per 1000 residents by state, including the District of Columbia (Source: U.S. Department of Transportation). (b) About what percentage of the states (out of 51) seem to have close to 800 licensed drivers per 1000 residents? (Round your answer to one decimal place.)arrow_forwardFind the range of the three graphs shown above in part 4 of Questionarrow_forwardSOURCE:https://www.researchgate.net/publication/362774303_Analysis_of_the_Impact_of_Carbon_Trading_Policies_on_Carbon_Emission_and_Carbon_Emission_EfficiencyDescribe at least three ways on how they presented the results of their study.Was it in table, graphs or purely texts? what are your observationsarrow_forward
- (context in image #1) (chart in image #2) #11 if the rabbit population had a minimum of 4000 and a maximum of 20,000 how would the graph and chart changearrow_forwardQuestion 6 For the graph shown below, which Area of Study had all of its salaries between $52,000 and $30,000? Culinary Arts Information Technology Transportation Technology Health and Human Services Business Administration Advanced Manufacturingarrow_forward
arrow_back_ios
arrow_forward_ios
Recommended textbooks for you
 Algebra: Structure And Method, Book 1AlgebraISBN:9780395977224Author:Richard G. Brown, Mary P. Dolciani, Robert H. Sorgenfrey, William L. ColePublisher:McDougal Littell
 Algebra & Trigonometry with Analytic GeometryAlgebraISBN:9781133382119Author:SwokowskiPublisher:Cengage
Algebra: Structure And Method, Book 1
Algebra
ISBN:9780395977224
Author:Richard G. Brown, Mary P. Dolciani, Robert H. Sorgenfrey, William L. Cole
Publisher:McDougal Littell
Algebra & Trigonometry with Analytic Geometry
Algebra
ISBN:9781133382119
Author:Swokowski
Publisher:Cengage
Which is the best chart: Selecting among 14 types of charts Part II; Author: 365 Data Science;https://www.youtube.com/watch?v=qGaIB-bRn-A;License: Standard YouTube License, CC-BY