
Statistical Reasoning for Everyday Life, Books a la Carte Edition, Plus NEW MyLab Statistics with Pearson eText -- Access Card Package (5th Edition)
5th Edition
ISBN: 9780134668390
Author: Jeffrey O. Bennett, William L. Briggs, Mario F. Triola
Publisher: PEARSON
expand_more
expand_more
format_list_bulleted
Concept explainers
Videos
Textbook Question
Chapter 2.4, Problem 24E
Pizza Cost and Subway Fare. The “pizza connection” refers to the observation that in New York City, the cost of a slice of pizza is always about the same as the subway fare. In Exercises 21–24, use the CPI values from Table 2.2 and the data in the following table.
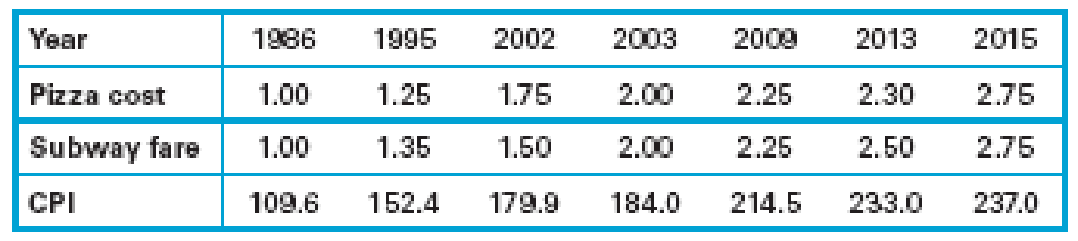
24. Subway Fare in 1990. Using the CPI values from the above table and Table 2.2, determine what the subway fare should have cost in 1990 if it cost $2.75 in 2015 and prices had risen with the CPI. What does this tell you about how actual subway fares changed compared to the CPI?
Expert Solution & Answer
Want to see the full answer?
Check out a sample textbook solution
Students have asked these similar questions
Several states have argued that the 65-mph speed limit has no justification and have refused to enforce it. The federal Department of Transportation (DOT) believes that the 65-mph limit saves lives. To illustrate its contention, the department regressed the number of traffic fatalities (Y) last year in a state on the state’s population (X1), the number of days of snow cover (X2), and the average speed of all cars (X3). The results are shown below.
Table 10: Model Summary
Model
R
R Square
Adjusted R Square
Std. Error of the Estimate
1
.821 a
.780
.613
3.258
a. Predictors: (Constant), population, days of snow, average speed
Table 11: Coefficients
Coefficientsa
Model
Unstandardized Coefficients
Standardized Coefficients
t
Sig.
B
Std. Error
Beta
1
(Constant)
1.4
2.957
.473
.584
Population
.00029
.00003
.0034
9.667
.000
Days of Snow
2.4
.62
.759
3.871
.000
Average Speed
10.3
1.1…
d) Prepare the scatter diagram and insert the trendline or line of best-fit. Use a scale of 2 cm to represent 1,000 units on the x-axis & 2 cm to represent $50,000 on the yaxis.e) Using the line of best-fit, determine the company’s fixed cost per month and the variable cost per unit. (Use 0 & 5,000 units.)f) Which of the two methods appear more appropriate? Explain your answer
Part c: What percentage of an adult size brain does a child have at age 10?
Part d: Determine whether the value from the model is larger or smaller than the value in the table.
Chapter 2 Solutions
Statistical Reasoning for Everyday Life, Books a la Carte Edition, Plus NEW MyLab Statistics with Pearson eText -- Access Card Package (5th Edition)
Ch. 2.1 - Qualitative versus Quantitative. What is the...Ch. 2.1 - Discrete versus Continuous. Distinguish between...Ch. 2.1 - Measurement Levels. What do we mean by data at the...Ch. 2.1 - Interval versus Ratio. Explain why temperatures on...Ch. 2.1 - Does It Make Sense? For Exercises 58, determine...Ch. 2.1 - Does It Make Sense? For Exercises 58, determine...Ch. 2.1 - Does It Make Sense? For Exercises 58, determine...Ch. 2.1 - Does It Make Sense? For Exercises 58, determine...Ch. 2.1 - Does It Make Sense? For Exercises 58, determine...Ch. 2.1 - Does It Make Sense? For Exercises 58, determine...
Ch. 2.1 - Does It Make Sense? For Exercises 58, determine...Ch. 2.1 - Does It Make Sense? For Exercises 58, determine...Ch. 2.1 - Does It Make Sense? For Exercises 58, determine...Ch. 2.1 - Does It Make Sense? For Exercises 58, determine...Ch. 2.1 - Does It Make Sense? For Exercises 58, determine...Ch. 2.1 - Does It Make Sense? For Exercises 58, determine...Ch. 2.1 - Qualitative versus Quantitative Data. In Exercises...Ch. 2.1 - Qualitative versus Quantitative Data. In Exercises...Ch. 2.1 - Discrete or Continuous. In Exercises 1928, state...Ch. 2.1 - Discrete or Continuous. In Exercises 1928, state...Ch. 2.1 - Discrete or Continuous. In Exercises 1928, state...Ch. 2.1 - Discrete or Continuous. In Exercises 1928, state...Ch. 2.1 - Discrete or Continuous. In Exercises 1928, state...Ch. 2.1 - Discrete or Continuous. In Exercises 1928, state...Ch. 2.1 - Discrete or Continuous. In Exercises 1928, state...Ch. 2.1 - Discrete or Continuous. In Exercises 1928, state...Ch. 2.1 - Discrete or Continuous. In Exercises 1928, state...Ch. 2.1 - Discrete or Continuous. In Exercises 1928, state...Ch. 2.1 - Levels of Measurement. For the data described in...Ch. 2.1 - Levels of Measurement. For the data described in...Ch. 2.1 - Levels of Measurement. For the data described in...Ch. 2.1 - Levels of Measurement. For the data described in...Ch. 2.1 - Levels of Measurement. For the data described in...Ch. 2.1 - Levels of Measurement. For the data described in...Ch. 2.1 - Levels of Measurement. For the data described in...Ch. 2.1 - Levels of Measurement. For the data described in...Ch. 2.1 - Levels of Measurement. For the data described in...Ch. 2.1 - Levels of Measurement. For the data described in...Ch. 2.1 - Levels of Measurement. For the data described in...Ch. 2.1 - Levels of Measurement. For the data described in...Ch. 2.1 - Meaningful Ratios? In Exercises 4148, determine...Ch. 2.1 - Meaningful Ratios? In Exercises 4148, determine...Ch. 2.1 - Meaningful Ratios? In Exercises 4148, determine...Ch. 2.1 - Meaningful Ratios? In Exercises 4148, determine...Ch. 2.1 - Meaningful Ratios? In Exercises 4148, determine...Ch. 2.1 - Meaningful Ratios? In Exercises 4148, determine...Ch. 2.1 - Meaningful Ratios? In Exercises 4148, determine...Ch. 2.1 - Meaningful Ratios? In Exercises 4148, determine...Ch. 2.1 - Complete Classification. In Exercises 4956,...Ch. 2.1 - Complete Classification. In Exercises 4956,...Ch. 2.1 - Complete Classification. In Exercises 4956,...Ch. 2.1 - Complete Classification. In Exercises 4956,...Ch. 2.1 - Prob. 53ECh. 2.1 - Complete Classification. In Exercises 4956,...Ch. 2.1 - Prob. 55ECh. 2.1 - Complete Classification. In Exercises 4956,...Ch. 2.2 - Error Type. Distinguish between random errors and...Ch. 2.2 - Absolute and Relative. Distinguish between the...Ch. 2.2 - Accuracy and Precision. Distinguish between...Ch. 2.2 - Honest Numbers. Why can it be misleading to give...Ch. 2.2 - Does It Make Sense? For Exercises 58, determine...Ch. 2.2 - Does It Make Sense? For Exercises 58, determine...Ch. 2.2 - Does It Make Sense? For Exercises 58, determine...Ch. 2.2 - Does It Make Sense? For Exercises 58, determine...Ch. 2.2 - IRS. An IRS agent reviews tax returns to identify...Ch. 2.2 - Safe Air Travel. Before taking off, a pilot is...Ch. 2.2 - Technical Specifications. A smartphone battery is...Ch. 2.2 - Crime Statistics. Former New York City Police...Ch. 2.2 - Sources of Errors. For each measurement described...Ch. 2.2 - Sources of Errors. For each measurement described...Ch. 2.2 - Sources of Errors. For each measurement described...Ch. 2.2 - Sources of Errors. For each measurement described...Ch. 2.2 - Sources of Errors. For each measurement described...Ch. 2.2 - Sources of Errors. For each measurement described...Ch. 2.2 - Sources of Errors. For each measurement described...Ch. 2.2 - Sources of Errors. For each measurement described...Ch. 2.2 - Absolute and Relative Errors. In Exercises 2124,...Ch. 2.2 - Absolute and Relative Errors. In Exercises 2124,...Ch. 2.2 - Absolute and Relative Errors. In Exercises 2124,...Ch. 2.2 - Absolute and Relative Errors. In Exercises 2124,...Ch. 2.2 - Minimizing Errors. Twenty-five people, including...Ch. 2.2 - Minimizing Errors. When a model 22F car battery is...Ch. 2.2 - Accuracy and Precision in Corvette Weight. A new...Ch. 2.2 - Accuracy and Precision in Height. Assume that your...Ch. 2.2 - Accuracy and Precision in Weight. Suppose your...Ch. 2.2 - Prob. 30ECh. 2.2 - Believable Facts? Exercises 3138 give statements...Ch. 2.2 - Believable Facts? Exercises 3138 give statements...Ch. 2.2 - Prob. 33ECh. 2.2 - Believable Facts? Exercises 3138 give statements...Ch. 2.2 - Prob. 35ECh. 2.2 - Believable Facts? Exercises 3138 give statements...Ch. 2.2 - Believable Facts? Exercises 3138 give statements...Ch. 2.2 - Believable Facts? Exercises 3138 give statements...Ch. 2.3 - Statistical Literacy and Critical Thinking...Ch. 2.3 - Percentage Difference. Distinguish between...Ch. 2.3 - Of versus More Than. Explain the difference...Ch. 2.3 - Percentage Points. Explain the difference between...Ch. 2.3 - Does It Make Sense? For Exercises 58, determine...Ch. 2.3 - Does It Make Sense? For Exercises 58, determine...Ch. 2.3 - Does It Make Sense? For Exercises 58, determine...Ch. 2.3 - Does It Make Sense? For Exercises 58, determine...Ch. 2.3 - Concepts and Applications Fractions, Decimals,...Ch. 2.3 - Fractions, Decimals, Percentages. Express the...Ch. 2.3 - Percentage Practice. A study was conducted of...Ch. 2.3 - Percentage Practice. A study was conducted to...Ch. 2.3 - Percentage of Media commonly report survey...Ch. 2.3 - Percentage. A New York Times editorial criticized...Ch. 2.3 - Relative Change. Exercises 1522 each provide two...Ch. 2.3 - Relative Change. Exercises 1522 each provide two...Ch. 2.3 - Relative Change. Exercises 1522 each provide two...Ch. 2.3 - Relative Change. Exercises 1522 each provide two...Ch. 2.3 - Relative Change. Exercises 1522 each provide two...Ch. 2.3 - Relative Change. Exercises 1522 each provide two...Ch. 2.3 - Relative Change. Exercises 1522 each provide two...Ch. 2.3 - Relative Change. Exercises 1522 each provide two...Ch. 2.3 - Surveys. Some important analyses of survey results...Ch. 2.3 - Surveys. Some important analyses of survey results...Ch. 2.3 - Surveys. Some important analyses of survey results...Ch. 2.3 - Surveys. Some important analyses of survey results...Ch. 2.3 - Of versus More Than. Fill in the blanks in...Ch. 2.3 - Of versus More Than. Fill in the blanks in...Ch. 2.3 - Of versus More Than. Fill in the blanks in...Ch. 2.3 - Of versus More Than. Fill in the blanks in...Ch. 2.3 - Margin of Error. A Gallup poll of 1012 American...Ch. 2.3 - Margin of Error. A Pew Research Center survey of...Ch. 2.3 - Percentages of Percentages. Exercises 3336...Ch. 2.3 - Percentages of Percentages. Exercises 3336...Ch. 2.3 - Percentages of Percentages. Exercises 3336...Ch. 2.3 - Percentages of Percentages. Exercises 3336...Ch. 2.3 - TV Share. A recent Super Bowl football game had a...Ch. 2.3 - Misleading Percentage. In a Gallup poll of 1236...Ch. 2.4 - Index Number. What is an index number? Briefly...Ch. 2.4 - CPI. What is the Consumer Price Index (CPI)? How...Ch. 2.4 - Inflation. In making price comparisons, why is it...Ch. 2.4 - CPI Change. If the CPI increases, must wages also...Ch. 2.4 - Does It Make Sense? For Exercises 58, determine...Ch. 2.4 - Does It Make Sense? For Exercises 58, determine...Ch. 2.4 - Does It Make Sense? For Exercises 58, determine...Ch. 2.4 - Does It Make Sense? For Exercises 58, determine...Ch. 2.4 - Consumer Price Index. In Exercises 916, use the...Ch. 2.4 - Consumer Price Index. In Exercises 916, use the...Ch. 2.4 - Consumer Price Index. In Exercises 916, use the...Ch. 2.4 - Consumer Price Index. In Exercises 916, use the...Ch. 2.4 - Prob. 13ECh. 2.4 - Consumer Price Index. In Exercises 916, use the...Ch. 2.4 - Consumer Price Index. In Exercises 916, use the...Ch. 2.4 - Consumer Price Index. In Exercises 916, use the...Ch. 2.4 - Coffee Index. In Exercises 1720, use the following...Ch. 2.4 - Prob. 18ECh. 2.4 - Prob. 19ECh. 2.4 - Coffee Index. In Exercises 1720, use the following...Ch. 2.4 - Pizza Cost and Subway Fare. The pizza connection...Ch. 2.4 - Pizza Cost and Subway Fare. The pizza connection...Ch. 2.4 - Pizza Cost and Subway Fare. The pizza connection...Ch. 2.4 - Pizza Cost and Subway Fare. The pizza connection...Ch. 2.4 - Prob. 25ECh. 2.4 - Prob. 26ECh. 2.4 - Prob. 27ECh. 2.4 - Housing Price Index. Realtors use an index to...Ch. 2.4 - Prob. 29ECh. 2.4 - Housing Price Index. Realtors use an index to...Ch. 2.4 - Prob. 31ECh. 2.4 - Housing Price Index. Realtors use an index to...Ch. 2 - Germs. In a Wakefield Research survey, 1003...Ch. 2 - Health Care Spending. Total spending on health...Ch. 2 - Prob. 3CRECh. 2 - Minimum Wage. The following table lists the...Ch. 2 - Braking reaction times of 36 randomly selected...Ch. 2 - What is the level of measurement of the values...Ch. 2 - Prob. 3CQCh. 2 - A researcher measures the braking reaction time of...Ch. 2 - Braking reaction times of 36 randomly selected...Ch. 2 - Recorded survey results include the states in...Ch. 2 - Prob. 7CQCh. 2 - Prob. 8CQCh. 2 - Prob. 9CQCh. 2 - Prob. 10CQCh. 2 - Politics Who Benefited Most from Lower Tax Rates?...Ch. 2 - Prob. 1.2FCh. 2 - Prob. 1.3F
Knowledge Booster


Learn more about
Need a deep-dive on the concept behind this application? Look no further. Learn more about this topic, statistics and related others by exploring similar questions and additional content below.Similar questions
- Use this data for the exercises that follow: In 2013, there were roughly 317 million citizens in the United States, and about 40 million were elderly (aged 65 and over).[34] 60. It is predicted that by 2030, one in five U.S. citizens will be elderly. How much greater will the chances of meeting an elderly person be at that time? What policy changes do you foresee if these statistics hold true?arrow_forwardDetermine if the following scenarios involve an observational study or an experiment. Make sure your answers are legible and spelled correctly. A team of ecologists determines the different species of frogs that live in the local swamplands. A medical researcher divides patients into a treatment group and a control group to determine the effect of a new drug on overall cholesterol levels in patients. A medical insurance company determines the average cost to cover a tooth extraction procedure over the past 3 years. As part of a medical study to determine the effectiveness of a new technique for abdominal surgery, patients undergo the surgery with the new technique or with a traditional technique. The recovery time from surgery is then compared for the two different techniques. The general manager of a baseball team determines the on-base percentage (OBP) for his players over the past two seasons. A dietitian examined the effectiveness of a weight-loss program by randomly…arrow_forwardAn aerobic exercise instructor remembers the data given in the following table, which shows the recommended maximum exercise heart rates for individuals of the given ages. Predict the maximum exercise heart rate of a person who is 72 years old Age (x years) 20 30 40 50 60 Maximum heart rate (y beats per minute) 170 168 153 147 136arrow_forward
- A student constructs the scatterplot below and concludes that the price increased by the same amount every two years. By referring to the data table do you agree with the student? Explain. arrow_forwardThe amount of income spent on housing is an important component of the cost of living. The total costs of housing for homeowners might include mortgage payments, property taxes, and utility costs (water, heat, electricity). An economist selected a sample of 20 homeowners in New England and then calculated these total housing costs as a percent of monthly income, 5 years ago and now. The information is reported below. Is it reasonable to conclude the percent is less now than 5 years ago? Homeowner Five Years Ago Now Homeowner Five Years Ago Now 1 17 % 10 % 11 35 % 32 % 2 20 39 12 16 32 3 29 37 13 23 21 4 43 27 14 33 12 5 36 12 15 44 40 6 43 41 16 44 42 7 45 24 17 28 22 8 19 26 18 29 19 9 49 28 19 39 35 10 49…arrow_forwardFarmers know that driving heavy equipment on wet soil compresses the soil and injures future crops. Here are data on the "penetrability" of the same type of soil at two levels of compression. Penetrability is a measure of how much resistance plant roots will meet when they try to grow through the soil. Compressed Soil: 2.85 3.082.6 2.822.95 2.782.82 2.982.76 3.002.81 2.782.78 2.963.08 2.902.94 3.182.86 3.16 Intermediate Soil: 3.13 3.543.32 3.363.1 3.183.40 3.123.38 3.863.14 2.923.18 3.463.26 3.442.96 3.623.02 4.26 Use the data, omitting the high outlier, to give a 96% confidence interval for the decrease in penetrability of compressed soil relative to intermediate soil. Compute degrees of freedom using the conservative method.Interval: Toarrow_forward
- Data is givenarrow_forwardA researcher is interested in the effect of the pandemic on social media use among college students. The researcher hypothesizes that college students spend more time on social media thanthey did before the pandemic. To test his hypothesis, he randomly selected 50 college students and asked how many hours do they spend on social media per day before and after the pandemic. a) What is the research question? b) What is/are the variable(s)? What graphs can be used to display the variable(s) visually? c) What statistical test can be used to answer the research question?arrow_forwardSocial media is popular around the world. Statista provides estimate of the number of social media users in various countries in 2017 as well as the projections for 2022. Assume that the results for surveys in the United Kingdom, China, Russia, and the United States are as follows.arrow_forward
- Are very young infants more likely to imitate actions that are modeled by a person or simulated by an object? This question was the basis of a research study. One action examined was mouth opening. This action was modeled repeatedly by either a person or a doll, and the number of times that the infant imitated the behavior was recorded. Twenty-seven infants participated, with 12 exposed to a human model and 15 exposed to the doll. Summary values are shown below. Person Model Doll Model x 5.11 3.47 s 1.60 1.30 Is there sufficient evidence to conclude that the mean number of imitations is higher for infants who watch a human model than for infants who watch a doll? Test the relevant hypotheses using a 0.01 significance level. (Use ?Person − ?Doll.) Find the test statistic. (Round your answer to two decimal places.) t = Find the df. (Round your answer down to the nearest whole number.) df = Use technology to find the P-value. (Round your answer to four decimal places.)…arrow_forwardTV Viewing Times. Data from a sample of Americans yielded the following estimates of average TV viewing time per month for all Americans 2 years old and older. The times are in hours and minutes; Q1 stands for first quarter. [SOURCE: The Cross-Platform Report, Quarter 1, 2011. Published by The Nielsen Company, _c 2011.]arrow_forwardCellulon, a manufacturer of home insulation, wants to develop guidelines for builders and consumers on how the thickness of the insulation in the attic of a home and the outdoor temperature affect natural gas consumption. In the laboratory, it varied the insulation thickness and temperature. A few of the findings are: Monthly Natural Gas Consumption (cubic feet), Y Thickness of Insulation (inches), X1 Outdoor Temperature (°F), X2 30.3 6 40 26.9 12 40 22.1 8 49 How much natural gas can homeowners expect to use per month if they install 6 inches of insulation and the outdoor temperature is 40 degrees F? Group of answer choices 36.69 cubic feet 30.30 cubic feet 30.89 cubic feet 33.69 cubic feetarrow_forward
arrow_back_ios
SEE MORE QUESTIONS
arrow_forward_ios
Recommended textbooks for you
 Glencoe Algebra 1, Student Edition, 9780079039897...AlgebraISBN:9780079039897Author:CarterPublisher:McGraw Hill
 Linear Algebra: A Modern IntroductionAlgebraISBN:9781285463247Author:David PoolePublisher:Cengage Learning
 Big Ideas Math A Bridge To Success Algebra 1: Stu...AlgebraISBN:9781680331141Author:HOUGHTON MIFFLIN HARCOURTPublisher:Houghton Mifflin Harcourt
Glencoe Algebra 1, Student Edition, 9780079039897...
Algebra
ISBN:9780079039897
Author:Carter
Publisher:McGraw Hill
Linear Algebra: A Modern Introduction
Algebra
ISBN:9781285463247
Author:David Poole
Publisher:Cengage Learning
Big Ideas Math A Bridge To Success Algebra 1: Stu...
Algebra
ISBN:9781680331141
Author:HOUGHTON MIFFLIN HARCOURT
Publisher:Houghton Mifflin Harcourt
Correlation Vs Regression: Difference Between them with definition & Comparison Chart; Author: Key Differences;https://www.youtube.com/watch?v=Ou2QGSJVd0U;License: Standard YouTube License, CC-BY
Correlation and Regression: Concepts with Illustrative examples; Author: LEARN & APPLY : Lean and Six Sigma;https://www.youtube.com/watch?v=xTpHD5WLuoA;License: Standard YouTube License, CC-BY