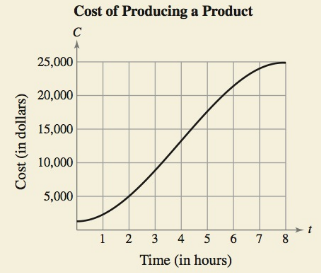
HOW DO YOU SEE IT? The cost C (In dollars) of producing x units of a product is C = 60 x + 1350. For one week, management determined that the number of units produced x at the end of t hours was x = − 1.6 t 3 + 19 t 2 − 0.5 t − 1 . The graph shows the cost C in terms of the time t . Using the graph, which is greater, the rate of change of the cost after 1 hour or the rate of change of the cost after 4 hours? Explain why the cost function is not increasing at a constant rate during the eight-hour shift.
HOW DO YOU SEE IT? The cost C (In dollars) of producing x units of a product is C = 60 x + 1350. For one week, management determined that the number of units produced x at the end of t hours was x = − 1.6 t 3 + 19 t 2 − 0.5 t − 1 . The graph shows the cost C in terms of the time t . Using the graph, which is greater, the rate of change of the cost after 1 hour or the rate of change of the cost after 4 hours? Explain why the cost function is not increasing at a constant rate during the eight-hour shift.
Solution Summary: The author analyzes the rate of change of cost after 1 hour or after 4 hours using the graph.
HOW DO YOU SEE IT? The cost C (In dollars) of producing x units of a product is C = 60x + 1350. For one week, management determined that the number of units produced x at the end of t hours was
x
=
−
1.6
t
3
+
19
t
2
−
0.5
t
−
1
. The graph shows the cost C in terms of the time t.
Using the graph, which is greater, the rate of change of the cost after 1 hour or the rate of change of the cost after 4 hours?
Explain why the cost function is not increasing at a constant rate during the eight-hour shift.
Need a deep-dive on the concept behind this application? Look no further. Learn more about this topic, calculus and related others by exploring similar questions and additional content below.
Linear Equation | Solving Linear Equations | What is Linear Equation in one variable ?; Author: Najam Academy;https://www.youtube.com/watch?v=tHm3X_Ta_iE;License: Standard YouTube License, CC-BY


 Trigonometry (MindTap Course List)TrigonometryISBN:9781337278461Author:Ron LarsonPublisher:Cengage Learning
 Big Ideas Math A Bridge To Success Algebra 1: Stu...AlgebraISBN:9781680331141Author:HOUGHTON MIFFLIN HARCOURTPublisher:Houghton Mifflin Harcourt
 Functions and Change: A Modeling Approach to Coll...AlgebraISBN:9781337111348Author:Bruce Crauder, Benny Evans, Alan NoellPublisher:Cengage Learning
 College AlgebraAlgebraISBN:9781305115545Author:James Stewart, Lothar Redlin, Saleem WatsonPublisher:Cengage Learning
 College Algebra (MindTap Course List)AlgebraISBN:9781305652231Author:R. David Gustafson, Jeff HughesPublisher:Cengage Learning