
Concept explainers
Videos
(a)
The graph using the graphical utility
(a)
Answer to Problem 70E
The graph gets increases monotonically.
Explanation of Solution
Given information:
The given equation as shown below,
Formula used:
The values are plotted against the positive x and y values.
Calculation:
Using a graphing utility, the graph of the model is as follows.
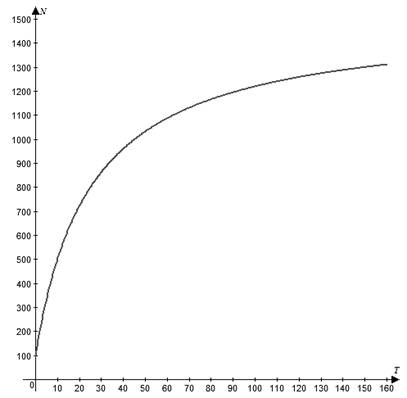
Conclusion:
The graph gets increases monotonically.
(b)
The populations when t=5; t=10; t=25
(b)
Answer to Problem 70E
The value of t=5 then N=333.33
The value of t=10 then N=500
The value of t=25 then N=800
Explanation of Solution
Given information:
The given equation as shown below,
Formula used:
The t values are replaced in
Calculation:
When t=5
When t=10
When t=25
Conclusion:
The N value gets increases as the temperature t increases
(c)
The limiting size of the herd as the time increases.
(c)
Answer to Problem 70E
The limiting size of the herd as time increases is 1,500
Explanation of Solution
Given information:
The given equation as shown below,
Formula used:
The t values are replaced in
Calculation:
As time increases, the limiting size of the herd is calculated as follows,
So the limiting size of the herd as time increases is 1,500
Conclusion:
The limiting size of the herd as time increases is 1,500
Chapter 2 Solutions
EBK PRECALCULUS W/LIMITS


 Calculus: Early TranscendentalsCalculusISBN:9781285741550Author:James StewartPublisher:Cengage Learning
 Thomas' Calculus (14th Edition)CalculusISBN:9780134438986Author:Joel R. Hass, Christopher E. Heil, Maurice D. WeirPublisher:PEARSON
 Calculus: Early Transcendentals (3rd Edition)CalculusISBN:9780134763644Author:William L. Briggs, Lyle Cochran, Bernard Gillett, Eric SchulzPublisher:PEARSON
 Calculus: Early TranscendentalsCalculusISBN:9781319050740Author:Jon Rogawski, Colin Adams, Robert FranzosaPublisher:W. H. Freeman
 Calculus: Early Transcendental FunctionsCalculusISBN:9781337552516Author:Ron Larson, Bruce H. EdwardsPublisher:Cengage Learning