Essential Statistics
2nd Edition
ISBN: 9781259570643
Author: Navidi
Publisher: MCG
bartleby

Concept explainers

bartleby

Videos

Textbook Question
Book Icon
Chapter 3, Problem 12RE

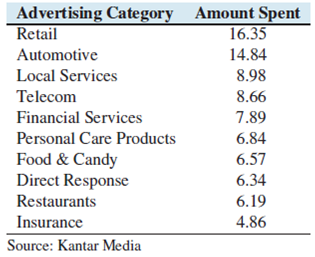
Advertising costs: The amounts spent (in billions) on media advertising in the United States for a sample of categories in a recent year are presented in the following table.

Chapter 3, Problem 12RE, Advertising costs: The amounts spent (in billions) on media advertising in the United States for a

  1. a. Find the mean amount spent on advertising.
  2. b. Find the median amount spent on advertising.
  3. c. Find the sample variance of the advertising amounts.
  4. d. Find the sample standard deviation of the advertising amounts.
  5. e. Find the first quartile of the advertising amounts.
  6. f. Find the third quartile of the advertising amounts.
  7. g. Find the 40th percentile of the advertising amounts.
  8. h. Find the 65th percentile of the advertising amounts.

a.

Expert Solution
Check Mark
To determine

Find the mean amount spent on advertising.

Answer to Problem 12RE

The mean amount spent on advertising is $8.75.

Explanation of Solution

Calculation:

The amount spent on advertising of U.S. is given.

Mean:

Computation of mean:

If x1,x2...xn be n values.

The mean value is calculated as,

Mean=sum of all valuesnumber of values=i=1nxin

Software procedure:

Step-by-step procedure to find the mean using the MINITAB software:

  • Choose Stat > Basic Statistics > Display Descriptive Statistics.
  • In Variables enter the columns Amount.
  • Choose option statistics, and select N total, Mean.
  • Click OK.

Output using the MINITAB software is given below:

  • Essential Statistics, Chapter 3, Problem 12RE , additional homework tip  1

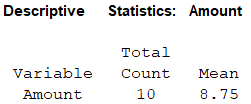
Thus, the mean amount spent on advertising is $8.75.

b.

Expert Solution
Check Mark
To determine

Find the median amount spent on advertising.

Answer to Problem 12RE

The median amount spent on advertising is 7.37.

Explanation of Solution

Calculation:

Median:

Let x1,x2...xn be n values.

The steps for finding the median:

  • The all data values should be arranged in ascending order.
  • If the total number of data values, n is odd, then the median will be the middle value or if n is even, then the median will be the average of middle two values.

Software procedure:

Step-by-step procedure to find the median and using the MINITAB software:

  • Choose Stat > Basic Statistics > Display Descriptive Statistics.
  • In Variables enter the columns Amount.
  • Choose option statistics, and select N total, Median.
  • Click OK.

Output using the MINITAB software is given below:

  • Essential Statistics, Chapter 3, Problem 12RE , additional homework tip  2

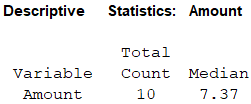
Thus, the median amount spent on advertising is $7.37.

c.

Expert Solution
Check Mark
To determine

Find the sample variance of amount spent on advertising.

Answer to Problem 12RE

The sample variance of amount spent on advertising is 14.62.

Explanation of Solution

Calculation:

Sample variance:

Let x1,x2...xn be the sample observations of size n. the sample mean is denoted by μ. Hence, the sample variance can be expressed as,

σ2=(xμ)2n1

Software procedure:

Step-by-step procedure to find the sample variance and using the MINITAB software:

  • Choose Stat > Basic Statistics > Display Descriptive Statistics.
  • In Variables enter the columns process.
  • Choose option statistics, and select N total, variance.
  • Click OK.

Output using the MINITAB software is given below:

  • Essential Statistics, Chapter 3, Problem 12RE , additional homework tip  3

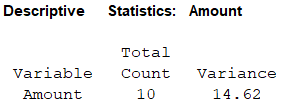
Thus, the sample variance of amount spent on advertising is 14.62.

d.

Expert Solution
Check Mark
To determine

Find the sample standard deviation of amount spent on advertising.

Answer to Problem 12RE

The sample standard deviation of amount spent on advertising is $3.82.

Explanation of Solution

Calculation:

Sample standard deviation:

The sample standard deviation is expressed as,

SD=σ2=σ

Software procedure:

Step-by-step procedure to find the sample standard deviation and using the MINITAB software:

  • Choose Stat > Basic Statistics > Display Descriptive Statistics.
  • In Variables enter the columns Amount.
  • Choose option statistics, and select N total, standard deviation.
  • Click OK.

Output using the MINITAB software is given below:

  • Essential Statistics, Chapter 3, Problem 12RE , additional homework tip  4

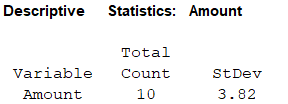
Thus, the sample standard deviation of amount spent on advertising is $3.82.

e.

Expert Solution
Check Mark
To determine

Find the first quartile.

Answer to Problem 12RE

The first quartile is 6.34.

Explanation of Solution

Calculation:

First quartile:

  • The first quartile separates the lowest 25% of the observations from the other 75% of the observations. The first quartile is denoted by Q1.
  • Procedure for finding the first quartile:
  • Step 1: The observations should be arranged in increasing order.
  • Step 2: The size of the data is n.
  •                                     For finding first quartile, L=0.25n
  • Step 3: The quartile will be the average of the observation of the position L and the observation in position L+1, if L is a whole number. If the L value is not a whole number, the next higher whole number will be considered. The quartile is the observation in the position of rounded-up value.
  • The observations are arranged in increasing order:
  • {4.86,6.19,6.34,6.57,6.84,7.89,8.66,8.98,14.84,16.35}
  • The size of the data is n=10.
  • For finding first quartile,
  • L=0.25×10=2.5
  • Here, 2.5 is not a whole number, hence the 1st quartile will be the observation in the 3rd position.
  • From the arranged observations the first quartile is 6.34.

Hence, the first quartile is 6.34.

f.

Expert Solution
Check Mark
To determine

Find the third quartile.

Answer to Problem 12RE

The third quartile is 8.98.

Explanation of Solution

Calculation:

Third quartile:

  • The third quartile separates the lowest 75% of the observations from the other 25% of the observations. The third quartile is denoted by Q3.
  • Procedure for finding the third quartile:
  • Step 1: The observations should be arranged in increasing order.
  • Step 2: The size of the data is n.
  •                                     For finding third quartile, L=0.75n
  • Step 3: The quartile will be the average of the observation of the position L and the observation in position L+1, if L is a whole number. If the L value is not a whole number, the next higher whole number will be considered. The quartile is the observation in the position of rounded-up value.
  • The observations are arranged in increasing order:
  • {4.86,6.19,6.34,6.57,6.84,7.89,8.66,8.98,14.84,16.35}
  • The size of the data is n=10.
  • For finding third quartile,
  • L=0.75×10=7.5
  • Here, 7.5 is not a whole number, hence the 1st quartile will be the observation in the 8th position.
  • From the arranged observations the third quartile is 8.98.

Hence, the third quartile is 8.98.

g.

Expert Solution
Check Mark
To determine

Find the 40th percentile of the advertising amount.

Answer to Problem 12RE

The 40th percentile of the advertising amount is 6.705.

Explanation of Solution

Calculation:

pth percentile:

The pth percentile separates the lowest p% of the observations from the highest (100p)% of the observations.

Procedure for finding pth percentile:

  • Step 1: The observations should be arranged in increasing order.
  • Step 2: The size of the data is n.

                              For finding pth percentile, L=p100n

  • Step 3: The pth percentile will be the average of the observation of the position L and the observation in position L+1, if L is a whole number. If the L value is not a whole number, the next higher whole number will be considered. The pth percentile is the observation in the position of rounded-up value.
  • The observations are arranged in increasing order:
  • {4.86,6.19,6.34,6.57,6.84,7.89,8.66,8.98,14.84,16.35}
  • The size of the data is n=10.
  • For finding 40th percentile,
  • L=40100×10=4
  • Here, 4 is a whole number, hence the 40th percentile will be the average of the observations in the position of 4th and 5th .
  • From the arranged observations the 40th percentile is 6.57+6.842=6.705.

Hence, the 40th percentile is 6.705.

h.

Expert Solution
Check Mark
To determine

Find the 65th percentile of the advertising amount.

Answer to Problem 12RE

The 65th percentile of the advertising amount is 8.66.

Explanation of Solution

Calculation:

pth percentile:

The pth percentile separates the lowest p% of the observations from the highest (100p)% of the observations.

Procedure for finding pth percentile:

  • Step 1: The observations should be arranged in increasing order.
  • Step 2: The size of the data is n.

                              For finding pth percentile, L=p100n

  • Step 3: The pth percentile will be the average of the observation of the position L and the observation in position L+1, if L is a whole number. If the L value is not a whole number, the next higher whole number will be considered. The pth percentile is the observation in the position of rounded-up value.
  • The observations are arranged in increasing order:
  • {4.86,6.19,6.34,6.57,6.84,7.89,8.66,8.98,14.84,16.35}
  • The size of the data is n=10.
  • For finding 65th percentile,
  • L=65100×10=6.5
  • Here, 6.5 is not a whole number, hence the 65th percentile will be the observations in the position of 7th.
  • From the arranged observations the 65th percentile is 8.66.

Hence, the 65th percentile is 8.66.

Want to see more full solutions like this?

Subscribe now to access step-by-step solutions to millions of textbook problems written by subject matter experts!

Chapter 3 Solutions

Essential Statistics

Ch. 3.1 - Prob. 11ECh. 3.1 - Prob. 12ECh. 3.1 - Prob. 13ECh. 3.1 - Prob. 14ECh. 3.1 - Prob. 15ECh. 3.1 - Prob. 16ECh. 3.1 - Prob. 17ECh. 3.1 - 18. Find the mean, median, and mode for the...Ch. 3.1 - Prob. 19ECh. 3.1 - In Exercises 19–22, use the given frequency...Ch. 3.1 - Prob. 21ECh. 3.1 - In Exercises 19–22, use the given frequency...Ch. 3.1 - Prob. 23ECh. 3.1 - Prob. 24ECh. 3.1 - Prob. 25ECh. 3.1 - Prob. 26ECh. 3.1 - Prob. 27ECh. 3.1 - Prob. 28ECh. 3.1 - Prob. 29ECh. 3.1 - 30. Mean and median height: The National Center...Ch. 3.1 - 31. Hamburgers: An ABC News story reported the...Ch. 3.1 - Prob. 32ECh. 3.1 - Prob. 33ECh. 3.1 - Prob. 34ECh. 3.1 - Prob. 35ECh. 3.1 - 36. Beer: The following table presents the number...Ch. 3.1 - Prob. 37ECh. 3.1 - Prob. 38ECh. 3.1 - 39. Heavy football players: Following are the...Ch. 3.1 - Prob. 40ECh. 3.1 - Prob. 41ECh. 3.1 - 42. News flash: The following table presents the...Ch. 3.1 - Prob. 43ECh. 3.1 - Prob. 44ECh. 3.1 - Prob. 45ECh. 3.1 - Prob. 46ECh. 3.1 - Prob. 47ECh. 3.1 - Prob. 48ECh. 3.1 - Prob. 49ECh. 3.1 - Prob. 50ECh. 3.1 - Prob. 51ECh. 3.1 - 52. Sources of news: A sample of 32 U.S. adults...Ch. 3.1 - Prob. 53ECh. 3.1 - Prob. 54ECh. 3.1 - Prob. 55ECh. 3.1 - Prob. 56ECh. 3.1 - Prob. 57ECh. 3.1 - Prob. 58ECh. 3.1 - Prob. 59ECh. 3.1 - Prob. 60ECh. 3.1 - Prob. 61ECh. 3.1 - Prob. 62ECh. 3.1 - Prob. 63ECh. 3.1 - Prob. 64ECh. 3.1 - Prob. 65ECh. 3.1 - Prob. 66ECh. 3.1 - Prob. 67ECh. 3.1 - Prob. 68ECh. 3.1 - Prob. 69ECh. 3.1 - Prob. 70ECh. 3.1 - Prob. 71ECh. 3.1 - Prob. 72ECh. 3.1 - Prob. 73ECh. 3.1 - Prob. 74ECh. 3.2 - 1. Compute the population variance for the St....Ch. 3.2 - Prob. 2CYUCh. 3.2 - Prob. 3CYUCh. 3.2 - Prob. 4CYUCh. 3.2 - Prob. 5CYUCh. 3.2 - Prob. 6CYUCh. 3.2 - Prob. 7CYUCh. 3.2 - Prob. 8CYUCh. 3.2 - Prob. 9ECh. 3.2 - In Exercises 9–12, fill in each blank with the...Ch. 3.2 - Prob. 11ECh. 3.2 - In Exercises 9–12, fill in each blank with the...Ch. 3.2 - Prob. 13ECh. 3.2 - In Exercises 13–16, determine whether the...Ch. 3.2 - Prob. 15ECh. 3.2 - Prob. 16ECh. 3.2 - Prob. 17ECh. 3.2 - 18. Find the sample variance and standard...Ch. 3.2 - Prob. 19ECh. 3.2 - Prob. 20ECh. 3.2 - Prob. 21ECh. 3.2 - Prob. 22ECh. 3.2 - 23. Approximate the sample variance and standard...Ch. 3.2 - 24. Approximate the sample variance and standard...Ch. 3.2 - Prob. 25ECh. 3.2 - Prob. 26ECh. 3.2 - Prob. 27ECh. 3.2 - Prob. 28ECh. 3.2 - Prob. 29ECh. 3.2 - Prob. 30ECh. 3.2 - Prob. 31ECh. 3.2 - Prob. 32ECh. 3.2 - 33. Heavy football players: Following are the...Ch. 3.2 - 34. Beer: The following table presents the number...Ch. 3.2 - Prob. 35ECh. 3.2 - Prob. 36ECh. 3.2 - Prob. 37ECh. 3.2 - Prob. 38ECh. 3.2 - Prob. 39ECh. 3.2 - Prob. 40ECh. 3.2 - Prob. 41ECh. 3.2 - 42. Pay your bills: In a large sample of customer...Ch. 3.2 - Prob. 43ECh. 3.2 - Prob. 44ECh. 3.2 - Prob. 45ECh. 3.2 - 46. Pay your bills: For the data in Exercise 42,...Ch. 3.2 - Prob. 47ECh. 3.2 - 48. Internet providers: For the data in Exercise...Ch. 3.2 - Prob. 49ECh. 3.2 - Prob. 50ECh. 3.2 - Prob. 51ECh. 3.2 - Prob. 52ECh. 3.2 - Prob. 53ECh. 3.2 - Prob. 54ECh. 3.2 - Prob. 55ECh. 3.2 - Prob. 56ECh. 3.2 - Prob. 57ECh. 3.2 - Prob. 58ECh. 3.2 - Prob. 59ECh. 3.2 - Prob. 60ECh. 3.2 - Prob. 61ECh. 3.2 - Prob. 62ECh. 3.2 - Prob. 63ECh. 3.3 - Following are final exam scores, arranged in...Ch. 3.3 - Prob. 2CYUCh. 3.3 - Prob. 3CYUCh. 3.3 - Prob. 4CYUCh. 3.3 - Prob. 5ECh. 3.3 - In Exercises 5–8, fill in each blank with the...Ch. 3.3 - Prob. 7ECh. 3.3 - In Exercises 5–8, fill in each blank with the...Ch. 3.3 - Prob. 9ECh. 3.3 - In Exercises 9–12, determine whether the statement...Ch. 3.3 - Prob. 11ECh. 3.3 - Prob. 12ECh. 3.3 - A population has mean μ = 7 and standard deviation...Ch. 3.3 - Prob. 14ECh. 3.3 - Prob. 15ECh. 3.3 - Prob. 16ECh. 3.3 - Prob. 17ECh. 3.3 - Prob. 18ECh. 3.3 - Prob. 19ECh. 3.3 - For the data set a. Find the 80th percentile. b....Ch. 3.3 - Standardized tests: In a recent year, the mean...Ch. 3.3 - A fish story: The mean length of one-year-old...Ch. 3.3 - Prob. 23ECh. 3.3 - Blood pressure in women: The article referred to...Ch. 3.3 - Hazardous waste: Following is a list of the number...Ch. 3.3 - Cholesterol levels: The National Health and...Ch. 3.3 - Commuting to work: Jamie drives to work every...Ch. 3.3 - Windy city by the bay: Following are wind speeds...Ch. 3.3 - Caffeine: Following are the number of grams of...Ch. 3.3 - Nuclear power: The following table presents the...Ch. 3.3 - Place your bets: Recently, 28 states in the U.S....Ch. 3.3 - Hail to the chief: There have been 57 presidential...Ch. 3.3 - Prob. 33ECh. 3.3 - Prob. 34ECh. 3.3 - Prob. 35ECh. 3.3 - Automotive emissions: Following are levels of...Ch. 3.3 - Prob. 37ECh. 3.3 - Prob. 38ECh. 3.3 - Prob. 39ECh. 3.3 - Boxplot possible? Following is the five-number...Ch. 3.3 - Unusual boxplot: Ten residents of a town were...Ch. 3.3 - Prob. 42ECh. 3.3 - The vanishing outlier: Seven families live on a...Ch. 3.3 - Prob. 44ECh. 3.3 - Prob. 45ECh. 3 - Of the mean, median, and mode, which must be a...Ch. 3 - Prob. 2CQCh. 3 - Prob. 3CQCh. 3 - Prob. 4CQCh. 3 - Prob. 5CQCh. 3 - Prob. 6CQCh. 3 - Each of the following histograms represents a data...Ch. 3 - Prob. 8CQCh. 3 - Prob. 9CQCh. 3 - Prob. 10CQCh. 3 - Prob. 11CQCh. 3 - Prob. 12CQCh. 3 - Prob. 13CQCh. 3 - Prob. 14CQCh. 3 - Prob. 15CQCh. 3 - Prob. 1RECh. 3 - Prob. 2RECh. 3 - Prob. 3RECh. 3 - Prob. 4RECh. 3 - Prob. 5RECh. 3 - Prob. 6RECh. 3 - Measure that ball: Each of 16 students measured...Ch. 3 - Prob. 8RECh. 3 - Prob. 9RECh. 3 - How long can you talk? A manufacturer of cell...Ch. 3 - Prob. 11RECh. 3 - Advertising costs: The amounts spent (in billions)...Ch. 3 - Prob. 13RECh. 3 - Prob. 14RECh. 3 - Prob. 15RECh. 3 - Prob. 1WAICh. 3 - Explain why the Empirical Rule is more useful than...Ch. 3 - Prob. 3WAICh. 3 - Prob. 4WAICh. 3 - Prob. 5WAICh. 3 - Prob. 1CSCh. 3 - Prob. 2CSCh. 3 - Prob. 3CSCh. 3 - Prob. 4CSCh. 3 - Prob. 5CSCh. 3 - Prob. 6CSCh. 3 - Prob. 7CSCh. 3 - Prob. 8CSCh. 3 - Prob. 9CS
Knowledge Booster
Background pattern image
Statistics
Learn more about
Need a deep-dive on the concept behind this application? Look no further. Learn more about this topic, statistics and related others by exploring similar questions and additional content below.
Recommended textbooks for you
Text book image
Glencoe Algebra 1, Student Edition, 9780079039897...
Algebra
ISBN:9780079039897
Author:Carter
Publisher:McGraw Hill
The Shape of Data: Distributions: Crash Course Statistics #7; Author: CrashCourse;https://www.youtube.com/watch?v=bPFNxD3Yg6U;License: Standard YouTube License, CC-BY
Shape, Center, and Spread - Module 20.2 (Part 1); Author: Mrmathblog;https://www.youtube.com/watch?v=COaid7O_Gag;License: Standard YouTube License, CC-BY
Shape, Center and Spread; Author: Emily Murdock;https://www.youtube.com/watch?v=_YyW0DSCzpM;License: Standard Youtube License