Essential Statistics
2nd Edition
ISBN: 9781259570643
Author: Navidi
Publisher: MCG
bartleby

Videos

Question
Book Icon
Chapter 3.2, Problem 47E

a.

To determine

Find the number of new-borns whose weigh was less than 4,105 grams.

a.

Expert Solution
Check Mark

Answer to Problem 47E

The number of new-borns whose weigh was less than 4,105 grams are 521 or 522.

Explanation of Solution

Calculation:

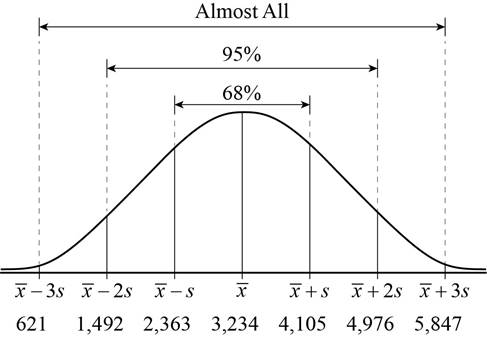
The mean birth weight of 621 new born babies is 3,234 grams and the standard deviation is 871 grams. The birth weight data is approximately bell-shaped.

The distribution is bell shaped, therefore empirical rule can be used here.

Empirical Rule:

If a sample with mean x¯ and standard deviation s has an approximately bell-shaped histogram them;

  • Approximately 68% of the observations lie between x¯s and x¯+s.
  • Approximately 95% of the observations lie between x¯2s and x¯+2s.
  • Approximately all of the observations lie between x¯3s and x¯+3s.

Here x¯=3,234 as the sample mean and the sample standard deviation is 871.

The 1 standard deviation limit is,

x¯±s=3,234±871=(2,363,4,105)

The 2 standard deviation limit is,

x¯±2s=3,234±(2×871)=3,234±1,742=(1,492,4,976)

The 3 standard deviation limit is,

x¯±3s=3,234±(3×871)=3,234±2,613=(621,5,847)

The graph of the limits is given below:

Essential Statistics, Chapter 3.2, Problem 47E

It is known that 50% of the observations lie in both sides of the mean, x¯.

By the graph it is clear that there will be 682=34% of the data in the limit (x¯,x¯+s).

Therefore, in left side of (x¯+s)=4,105, there will be 50%+34%=84% of the observation.

Total number of babies is 621.

84% of the babies is,

number of babies=621×84100=521.64

Hence, the number of new-borns whose weigh was less than 4,105 grams are 521 or 522.

b.

To determine

Find the number of new-borns whose weigh was greater than 1,492 grams.

b.

Expert Solution
Check Mark

Answer to Problem 47E

The number of new-borns whose weigh was greater than 1,492 grams is 605 or 606.

Explanation of Solution

Calculation:

It is known that 50% of the observations lie in both sides of the mean, x¯.

From the graph of part (a) it is clear that 95% observations lie between (x¯2s,x¯+2s).

Therefore, 95%2=47.5% of the observations lie in the interval (x¯2s,x¯).

Hence, in the right side of (x¯2s)=1,492, there will be 47.5%+50%=97.5% of observations.

Total number of babies is 621.

97.5% of the babies is,

number of babies=621×97.5100=605.475

Hence, the number of new-borns whose weigh was greater than 1,492 grams is 605 or 606.

c.

To determine

Find the number of new-borns whose weigh was between 3,234 and 4,976 grams.

c.

Expert Solution
Check Mark

Answer to Problem 47E

  • The number of new-born whose weigh was between 3,234 and 4,976 grams are 295.

Explanation of Solution

Calculation:

It is known that 50% of the observations lie in both sides of the mean, x¯.

From the graph of part (a) it is clear that 95% observations lies between (x¯2s,x¯+2s).

Therefore, 95%2=47.5% of the observations lie in the interval (x¯,x¯+2s).

Thus, {x¯(=3,234),x¯+2s(=4,976)} this interval consists of 47.5% of the observations.

Total number of babies is 621.

47.5% of the babies is,

number of babies=621×47.5100=294.975

  • Hence the number of new-born whose weigh was between 3,234 and 4,976 grams are 295.

Want to see more full solutions like this?

Subscribe now to access step-by-step solutions to millions of textbook problems written by subject matter experts!

Chapter 3 Solutions

Essential Statistics

Ch. 3.1 - Prob. 11ECh. 3.1 - Prob. 12ECh. 3.1 - Prob. 13ECh. 3.1 - Prob. 14ECh. 3.1 - Prob. 15ECh. 3.1 - Prob. 16ECh. 3.1 - Prob. 17ECh. 3.1 - 18. Find the mean, median, and mode for the...Ch. 3.1 - Prob. 19ECh. 3.1 - In Exercises 19–22, use the given frequency...Ch. 3.1 - Prob. 21ECh. 3.1 - In Exercises 19–22, use the given frequency...Ch. 3.1 - Prob. 23ECh. 3.1 - Prob. 24ECh. 3.1 - Prob. 25ECh. 3.1 - Prob. 26ECh. 3.1 - Prob. 27ECh. 3.1 - Prob. 28ECh. 3.1 - Prob. 29ECh. 3.1 - 30. Mean and median height: The National Center...Ch. 3.1 - 31. Hamburgers: An ABC News story reported the...Ch. 3.1 - Prob. 32ECh. 3.1 - Prob. 33ECh. 3.1 - Prob. 34ECh. 3.1 - Prob. 35ECh. 3.1 - 36. Beer: The following table presents the number...Ch. 3.1 - Prob. 37ECh. 3.1 - Prob. 38ECh. 3.1 - 39. Heavy football players: Following are the...Ch. 3.1 - Prob. 40ECh. 3.1 - Prob. 41ECh. 3.1 - 42. News flash: The following table presents the...Ch. 3.1 - Prob. 43ECh. 3.1 - Prob. 44ECh. 3.1 - Prob. 45ECh. 3.1 - Prob. 46ECh. 3.1 - Prob. 47ECh. 3.1 - Prob. 48ECh. 3.1 - Prob. 49ECh. 3.1 - Prob. 50ECh. 3.1 - Prob. 51ECh. 3.1 - 52. Sources of news: A sample of 32 U.S. adults...Ch. 3.1 - Prob. 53ECh. 3.1 - Prob. 54ECh. 3.1 - Prob. 55ECh. 3.1 - Prob. 56ECh. 3.1 - Prob. 57ECh. 3.1 - Prob. 58ECh. 3.1 - Prob. 59ECh. 3.1 - Prob. 60ECh. 3.1 - Prob. 61ECh. 3.1 - Prob. 62ECh. 3.1 - Prob. 63ECh. 3.1 - Prob. 64ECh. 3.1 - Prob. 65ECh. 3.1 - Prob. 66ECh. 3.1 - Prob. 67ECh. 3.1 - Prob. 68ECh. 3.1 - Prob. 69ECh. 3.1 - Prob. 70ECh. 3.1 - Prob. 71ECh. 3.1 - Prob. 72ECh. 3.1 - Prob. 73ECh. 3.1 - Prob. 74ECh. 3.2 - 1. Compute the population variance for the St....Ch. 3.2 - Prob. 2CYUCh. 3.2 - Prob. 3CYUCh. 3.2 - Prob. 4CYUCh. 3.2 - Prob. 5CYUCh. 3.2 - Prob. 6CYUCh. 3.2 - Prob. 7CYUCh. 3.2 - Prob. 8CYUCh. 3.2 - Prob. 9ECh. 3.2 - In Exercises 9–12, fill in each blank with the...Ch. 3.2 - Prob. 11ECh. 3.2 - In Exercises 9–12, fill in each blank with the...Ch. 3.2 - Prob. 13ECh. 3.2 - In Exercises 13–16, determine whether the...Ch. 3.2 - Prob. 15ECh. 3.2 - Prob. 16ECh. 3.2 - Prob. 17ECh. 3.2 - 18. Find the sample variance and standard...Ch. 3.2 - Prob. 19ECh. 3.2 - Prob. 20ECh. 3.2 - Prob. 21ECh. 3.2 - Prob. 22ECh. 3.2 - 23. Approximate the sample variance and standard...Ch. 3.2 - 24. Approximate the sample variance and standard...Ch. 3.2 - Prob. 25ECh. 3.2 - Prob. 26ECh. 3.2 - Prob. 27ECh. 3.2 - Prob. 28ECh. 3.2 - Prob. 29ECh. 3.2 - Prob. 30ECh. 3.2 - Prob. 31ECh. 3.2 - Prob. 32ECh. 3.2 - 33. Heavy football players: Following are the...Ch. 3.2 - 34. Beer: The following table presents the number...Ch. 3.2 - Prob. 35ECh. 3.2 - Prob. 36ECh. 3.2 - Prob. 37ECh. 3.2 - Prob. 38ECh. 3.2 - Prob. 39ECh. 3.2 - Prob. 40ECh. 3.2 - Prob. 41ECh. 3.2 - 42. Pay your bills: In a large sample of customer...Ch. 3.2 - Prob. 43ECh. 3.2 - Prob. 44ECh. 3.2 - Prob. 45ECh. 3.2 - 46. Pay your bills: For the data in Exercise 42,...Ch. 3.2 - Prob. 47ECh. 3.2 - 48. Internet providers: For the data in Exercise...Ch. 3.2 - Prob. 49ECh. 3.2 - Prob. 50ECh. 3.2 - Prob. 51ECh. 3.2 - Prob. 52ECh. 3.2 - Prob. 53ECh. 3.2 - Prob. 54ECh. 3.2 - Prob. 55ECh. 3.2 - Prob. 56ECh. 3.2 - Prob. 57ECh. 3.2 - Prob. 58ECh. 3.2 - Prob. 59ECh. 3.2 - Prob. 60ECh. 3.2 - Prob. 61ECh. 3.2 - Prob. 62ECh. 3.2 - Prob. 63ECh. 3.3 - Following are final exam scores, arranged in...Ch. 3.3 - Prob. 2CYUCh. 3.3 - Prob. 3CYUCh. 3.3 - Prob. 4CYUCh. 3.3 - Prob. 5ECh. 3.3 - In Exercises 5–8, fill in each blank with the...Ch. 3.3 - Prob. 7ECh. 3.3 - In Exercises 5–8, fill in each blank with the...Ch. 3.3 - Prob. 9ECh. 3.3 - In Exercises 9–12, determine whether the statement...Ch. 3.3 - Prob. 11ECh. 3.3 - Prob. 12ECh. 3.3 - A population has mean μ = 7 and standard deviation...Ch. 3.3 - Prob. 14ECh. 3.3 - Prob. 15ECh. 3.3 - Prob. 16ECh. 3.3 - Prob. 17ECh. 3.3 - Prob. 18ECh. 3.3 - Prob. 19ECh. 3.3 - For the data set a. Find the 80th percentile. b....Ch. 3.3 - Standardized tests: In a recent year, the mean...Ch. 3.3 - A fish story: The mean length of one-year-old...Ch. 3.3 - Prob. 23ECh. 3.3 - Blood pressure in women: The article referred to...Ch. 3.3 - Hazardous waste: Following is a list of the number...Ch. 3.3 - Cholesterol levels: The National Health and...Ch. 3.3 - Commuting to work: Jamie drives to work every...Ch. 3.3 - Windy city by the bay: Following are wind speeds...Ch. 3.3 - Caffeine: Following are the number of grams of...Ch. 3.3 - Nuclear power: The following table presents the...Ch. 3.3 - Place your bets: Recently, 28 states in the U.S....Ch. 3.3 - Hail to the chief: There have been 57 presidential...Ch. 3.3 - Prob. 33ECh. 3.3 - Prob. 34ECh. 3.3 - Prob. 35ECh. 3.3 - Automotive emissions: Following are levels of...Ch. 3.3 - Prob. 37ECh. 3.3 - Prob. 38ECh. 3.3 - Prob. 39ECh. 3.3 - Boxplot possible? Following is the five-number...Ch. 3.3 - Unusual boxplot: Ten residents of a town were...Ch. 3.3 - Prob. 42ECh. 3.3 - The vanishing outlier: Seven families live on a...Ch. 3.3 - Prob. 44ECh. 3.3 - Prob. 45ECh. 3 - Of the mean, median, and mode, which must be a...Ch. 3 - Prob. 2CQCh. 3 - Prob. 3CQCh. 3 - Prob. 4CQCh. 3 - Prob. 5CQCh. 3 - Prob. 6CQCh. 3 - Each of the following histograms represents a data...Ch. 3 - Prob. 8CQCh. 3 - Prob. 9CQCh. 3 - Prob. 10CQCh. 3 - Prob. 11CQCh. 3 - Prob. 12CQCh. 3 - Prob. 13CQCh. 3 - Prob. 14CQCh. 3 - Prob. 15CQCh. 3 - Prob. 1RECh. 3 - Prob. 2RECh. 3 - Prob. 3RECh. 3 - Prob. 4RECh. 3 - Prob. 5RECh. 3 - Prob. 6RECh. 3 - Measure that ball: Each of 16 students measured...Ch. 3 - Prob. 8RECh. 3 - Prob. 9RECh. 3 - How long can you talk? A manufacturer of cell...Ch. 3 - Prob. 11RECh. 3 - Advertising costs: The amounts spent (in billions)...Ch. 3 - Prob. 13RECh. 3 - Prob. 14RECh. 3 - Prob. 15RECh. 3 - Prob. 1WAICh. 3 - Explain why the Empirical Rule is more useful than...Ch. 3 - Prob. 3WAICh. 3 - Prob. 4WAICh. 3 - Prob. 5WAICh. 3 - Prob. 1CSCh. 3 - Prob. 2CSCh. 3 - Prob. 3CSCh. 3 - Prob. 4CSCh. 3 - Prob. 5CSCh. 3 - Prob. 6CSCh. 3 - Prob. 7CSCh. 3 - Prob. 8CSCh. 3 - Prob. 9CS
Knowledge Booster
Background pattern image
Statistics
Learn more about
Need a deep-dive on the concept behind this application? Look no further. Learn more about this topic, statistics and related others by exploring similar questions and additional content below.
Recommended textbooks for you
Text book image
MATLAB: An Introduction with Applications
Statistics
ISBN:9781119256830
Author:Amos Gilat
Publisher:John Wiley & Sons Inc
Text book image
Probability and Statistics for Engineering and th...
Statistics
ISBN:9781305251809
Author:Jay L. Devore
Publisher:Cengage Learning
Text book image
Statistics for The Behavioral Sciences (MindTap C...
Statistics
ISBN:9781305504912
Author:Frederick J Gravetter, Larry B. Wallnau
Publisher:Cengage Learning
Text book image
Elementary Statistics: Picturing the World (7th E...
Statistics
ISBN:9780134683416
Author:Ron Larson, Betsy Farber
Publisher:PEARSON
Text book image
The Basic Practice of Statistics
Statistics
ISBN:9781319042578
Author:David S. Moore, William I. Notz, Michael A. Fligner
Publisher:W. H. Freeman
Text book image
Introduction to the Practice of Statistics
Statistics
ISBN:9781319013387
Author:David S. Moore, George P. McCabe, Bruce A. Craig
Publisher:W. H. Freeman
Hypothesis Testing using Confidence Interval Approach; Author: BUM2413 Applied Statistics UMP;https://www.youtube.com/watch?v=Hq1l3e9pLyY;License: Standard YouTube License, CC-BY
Hypothesis Testing - Difference of Two Means - Student's -Distribution & Normal Distribution; Author: The Organic Chemistry Tutor;https://www.youtube.com/watch?v=UcZwyzwWU7o;License: Standard Youtube License