
Concept explainers
Videos
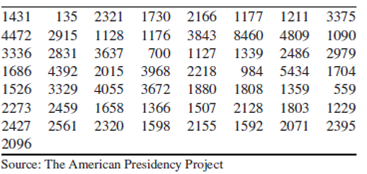
Hail to the chief: There have been 57 presidential inaugurations in U.S. history. At each one, the president has made an inaugural address. Following are the number of words spoken in each of these addresses.
- a. Find the first and third
quartiles of these data. - b. Find the median of these data.
- c. Find the upper and lower outlier boundaries.
- d. The two shortest speeches were 135 words, by George Washington in 1793, and 559 words, by Franklin Roosevelt in 1945. Are either of these outliers?
- e. The two longest speeches were 8460 words, by William Henry Harrison in 1841, and 5434 words, by William Howard Taft in 1909. Are either of these outliers?
- f. Construct a boxplot for these data.
- g. Describe the shape of this distribution.
- h. What is the 15th percentile?
- i. What is the 65th percentile?
- j. Barack Obama used 2395 words in his inauguration speech in 2009. What percentile is this?
a.
Find the first and the third quartiles of the data.
Answer to Problem 32E
The first and the third quartiles are 1,431and 2,915 respectively.
Explanation of Solution
Calculation:
- The number of words spoken in inaugural address of 57 presidential inaugurations in U.S history is given.
Three quartiles:
- The first quartile separates the lowest 25% of the observations from the other 75% of the observations. The first quartile is denoted by
- The second quartile separates the lower 50% of the observations from the other 50% of the observations. The second quartile is denoted by
- The third quartile separates the lowest 75% of the observations from the other 25% of the observations. The third quartile is denoted by
- Procedure for finding the first and the third quartile:
- Step 1: The observations should be arranged in increasing order.
- Step 2: The size of the data is n.
- For finding first quartile,
- For finding third quartile,
- Step 3: The quartile will be the average of the observation of the position L and the observation in position
- The observations are arranged in increasing order:
| 135 | 1,229 | 1,686 | 2,155 | 2,561 | 3,968 |
| 559 | 1,339 | 1,704 | 2,166 | 2,831 | 4,055 |
| 700 | 1,359 | 1,730 | 2,218 | 2,915 | 4,392 |
| 984 | 1,366 | 1,803 | 2,273 | 2,979 | 4,472 |
| 1,090 | 1,431 | 1,808 | 2,320 | 3,329 | 4,809 |
| 1,127 | 1,507 | 1,880 | 2,321 | 3,336 | 5,434 |
| 1,128 | 1,526 | 2,015 | 2,395 | 3,375 | 8,460 |
| 1,176 | 1,592 | 2,071 | 2,427 | 3,637 | |
| 1,177 | 1,598 | 2,096 | 2,459 | 3,672 | |
| 1,211 | 1,658 | 2,128 | 2,486 | 3,843 |
- The size of the data is
- For finding first quartile,
- Here, 14.25 is not a whole number, hence the 1st quartile will be the observation in the 15th position.
- From the arranged observations the first quartile is 1,431.
- For finding third quartile,
- Here, 42.75 is not a whole number, hence the 3rd quartile will be the observation in the 43rd position.
- From the arranged observations the third quartile is 2,915.
Hence, the first and the third quartiles are 1,431and 2,915 respectively.
b.
Find the median of the data.
Answer to Problem 32E
The median of the data is 2,096.
Explanation of Solution
Calculation:
Median:
Let
The steps for finding the median:
- The all data values should be arranged in ascending order.
- If the total number of data values, n is odd, then the median will be the middle value or if n is even, then the median will be the average of middle two values.
- The observations are arranged in increasing order:
| 135 | 1,229 | 1,686 | 2,155 | 2,561 | 3,968 |
| 559 | 1,339 | 1,704 | 2,166 | 2,831 | 4,055 |
| 700 | 1,359 | 1,730 | 2,218 | 2,915 | 4,392 |
| 984 | 1,366 | 1,803 | 2,273 | 2,979 | 4,472 |
| 1,090 | 1,431 | 1,808 | 2,320 | 3,329 | 4,809 |
| 1,127 | 1,507 | 1,880 | 2,321 | 3,336 | 5,434 |
| 1,128 | 1,526 | 2,015 | 2,395 | 3,375 | 8,460 |
| 1,176 | 1,592 | 2,071 | 2,427 | 3,637 | |
| 1,177 | 1,598 | 2,096 | 2,459 | 3,672 | |
| 1,211 | 1,658 | 2,128 | 2,486 | 3,843 |
- The size of the data is
- Hence, the sample size is odd. Therefore, the median is the observation of 29th position.
- From the arranged observations the median is 2,096.
Thus, the median of the data is 2,096.
c.
Find the lower and upper outlier boundaries.
Answer to Problem 32E
The lower and upper outlier boundaries are –795 and 5,141 respectively.
Explanation of Solution
Calculation:
Interquartile range:
- The interquartile range is the difference between the third quartile and first quartile. For detecting outlier this measure can be used.
- Interquartile range can be found as,
From part (a), the first and the third quartiles are 1,431and 2,915 respectively.
- Substitute these values in the interquartile range formula,
- Outlier boundaries:
- Lower outlier boundary is
- Upper outlier boundary is
- Where, the first quartile is denoted by
- Substitute these values in the formulae,
Thus, the lower and upper outlier boundaries are –795 and 5,141 respectively.
d.
Check whether the given two speeches are outlier or not.
Answer to Problem 32E
The values 135 and 559 are not outliers.
Explanation of Solution
It is given that in 1793, George Washington gave a speech of 135 words and in 1945, Franklin Roosevelt gave a speech of 559 words. These two are the shortest speeches.
- Condition for outlier:
- If any observation is less than the lower outlier boundary, the observation will be outlier.
- If any observation is greater than the upper outlier boundary, the observation will be outlier.
From part (c), the lower and upper outlier boundaries are –795 and 5,141 respectively.
135 and 559 both are greater than the lower outlier boundary and less than the upper outlier boundary. That is,
Hence, the values 135 and 559 are not outliers.
e.
Check whether the given two speeches are outlier or not.
Answer to Problem 32E
Both 8,460 and 5,434 are outliers.
Explanation of Solution
It is given that in 1841, Willian Henry Harrison gave a speech of 8,460 words and in 1909, William Howard Taft gave a speech of 5,434 words. These two are the longest speeches.
- Condition for outlier:
- If any observation is less than the lower outlier boundary, the observation will be outlier.
- If any observation is greater than the upper outlier boundary, the observation will be outlier.
From part (c), the lower and upper outlier boundaries are –795 and 5,141 respectively.
8,460 and 5,434 both are greater than the upper outlier boundary. That is,
Hence, both 8,460 and 5,434 are outliers.
f.
Draw a boxplot of the data.
Answer to Problem 32E
The boxplot is given below,
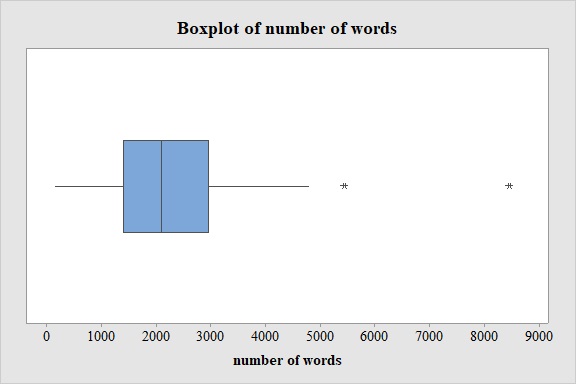
Explanation of Solution
Calculation:
- Boxplot:
Software procedure:
- Step-by-step procedure to draw a boxplot using the MINITAB software:
- Choose Graph > Boxplot.
- Choose Simple. Click OK.
- In Graph variables, enter the data of Number of words.
- Click OK.
Output using the MINITAB software is given below:
- From the MINITAB output, it is clear that there are two outliers in the data.
g.
Explain the shape of the distribution.
Answer to Problem 32E
The data is right skewed.
Explanation of Solution
The rule for determining the skewness from the Boxplot:
- The data is right skewed if the median is closer to the 1st quartile than the 3rd quartile or the upper whisker is longer than the lower whisker.
- The data is left skewed if the median is closer to the 3rd quartile than the 1st quartile or the lower whisker is longer than the upper whisker.
- The data is approximately symmetric if the median is the middle point of 1st quartile and the 3rd quartile or the length of the upper whisker and the lower whisker is approximately same.
From the Boxplot of part (f), is clear that the median is closer to the 1st quartile than the 3rd quartile or the upper whisker is slightly longer than the lower whisker.
By using the above rule, it can be said that the data is right skewed.
h.
Find the 15th percentile of the data.
Answer to Problem 32E
The 15th percentile is 1,177..
Explanation of Solution
Calculation:
pth percentile:
The pth percentile separates the lowest p% of the observations from the highest
Procedure for finding pth percentile:
- Step 1: The observations should be arranged in increasing order.
- Step 2: The size of the data is n.
For finding pth percentile,
- Step 3: The pth percentile will be the average of the observation of the position L and the observation in position
- The observations are arranged in increasing order:
| 135 | 1,229 | 1,686 | 2,155 | 2,561 | 3,968 |
| 559 | 1,339 | 1,704 | 2,166 | 2,831 | 4,055 |
| 700 | 1,359 | 1,730 | 2,218 | 2,915 | 4,392 |
| 984 | 1,366 | 1,803 | 2,273 | 2,979 | 4,472 |
| 1,090 | 1,431 | 1,808 | 2,320 | 3,329 | 4,809 |
| 1,127 | 1,507 | 1,880 | 2,321 | 3,336 | 5,434 |
| 1,128 | 1,526 | 2,015 | 2,395 | 3,375 | 8,460 |
| 1,176 | 1,592 | 2,071 | 2,427 | 3,637 | |
| 1,177 | 1,598 | 2,096 | 2,459 | 3,672 | |
| 1,211 | 1,658 | 2,128 | 2,486 | 3,843 |
- The size of the data is
- For finding 15th percentile,
- Here, 8.55 is not a whole number, hence the 15th percentile will be the value of 9th position.
- From the arranged observations the 15th percentile is 1,177.
Hence, the 15th percentile is 1,177.
i.
Find the 65th percentile of the data.
Answer to Problem 32E
The 65th percentile is 2,427.
Explanation of Solution
Calculation:
- The observations are arranged in increasing order:
| 135 | 1,229 | 1,686 | 2,155 | 2,561 | 3,968 |
| 559 | 1,339 | 1,704 | 2,166 | 2,831 | 4,055 |
| 700 | 1,359 | 1,730 | 2,218 | 2,915 | 4,392 |
| 984 | 1,366 | 1,803 | 2,273 | 2,979 | 4,472 |
| 1,090 | 1,431 | 1,808 | 2,320 | 3,329 | 4,809 |
| 1,127 | 1,507 | 1,880 | 2,321 | 3,336 | 5,434 |
| 1,128 | 1,526 | 2,015 | 2,395 | 3,375 | 8,460 |
| 1,176 | 1,592 | 2,071 | 2,427 | 3,637 | |
| 1,177 | 1,598 | 2,096 | 2,459 | 3,672 | |
| 1,211 | 1,658 | 2,128 | 2,486 | 3,843 |
- The size of the data is
- For finding 65th percentile,
- Here, 37.05 is not a whole number, hence the 65th percentile will be the observation in the 38th position.
- From the arranged observations the 65th percentile is 2,427.
Hence, the 65th percentile is 2,427.
j.
Find the percentile for the given speech.
Answer to Problem 32E
The value is of 65th percentile.
Explanation of Solution
Calculation:
It is given that Barak Obama used 2,395 words in his inauguration speech.
Procedure for finding the percentile for a given observation:
- The observations should be arranged in ascending order.
- If the observation is x, then the percentile of the observation is,
If the value is not a whole number the nearest whole number will be the percentile.
- The observations are arranged in increasing order:
| 135 | 1,229 | 1,686 | 2,155 | 2,561 | 3,968 |
| 559 | 1,339 | 1,704 | 2,166 | 2,831 | 4,055 |
| 700 | 1,359 | 1,730 | 2,218 | 2,915 | 4,392 |
| 984 | 1,366 | 1,803 | 2,273 | 2,979 | 4,472 |
| 1,090 | 1,431 | 1,808 | 2,320 | 3,329 | 4,809 |
| 1,127 | 1,507 | 1,880 | 2,321 | 3,336 | 5,434 |
| 1,128 | 1,526 | 2,015 | 2,395 | 3,375 | 8,460 |
| 1,176 | 1,592 | 2,071 | 2,427 | 3,637 | |
| 1,177 | 1,598 | 2,096 | 2,459 | 3,672 | |
| 1,211 | 1,658 | 2,128 | 2,486 | 3,843 |
Here,
From the observations, it is clear that there are 36 observations which are less than 2,395. Total number of observation is 57.
Hence, the percentile is,
- Here, 64.03 is not a whole number, hence value is of 65th percentile.
Hence, the value is of 65th percentile.
Want to see more full solutions like this?
Chapter 3 Solutions
Essential Statistics


 Glencoe Algebra 1, Student Edition, 9780079039897...AlgebraISBN:9780079039897Author:CarterPublisher:McGraw Hill
 Holt Mcdougal Larson Pre-algebra: Student Edition...AlgebraISBN:9780547587776Author:HOLT MCDOUGALPublisher:HOLT MCDOUGAL
 Big Ideas Math A Bridge To Success Algebra 1: Stu...AlgebraISBN:9781680331141Author:HOUGHTON MIFFLIN HARCOURTPublisher:Houghton Mifflin Harcourt