
Concept explainers
Videos
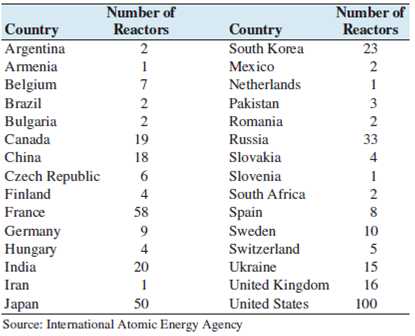
Nuclear power: The following table presents the number of nuclear reactors in a recent year in each country that had one or more reactors.
a. Find the first and third
b. Find the median of these data.
c. Find the upper and lower outlier boundaries.
d. Which countries are outliers?
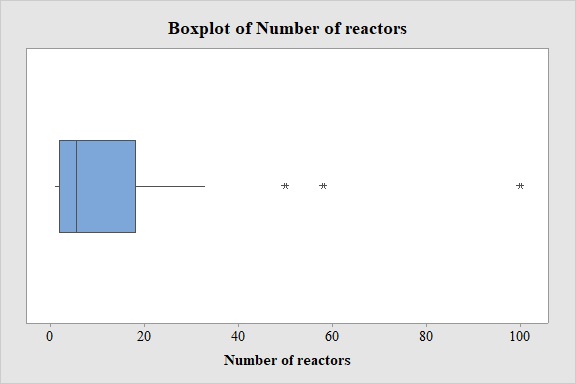
e. Construct a boxplot for these data.
f. Describe the shape of this distribution.
g. What is the 45th percentile?
h. What is the 88th percentile?
i. India has 20 nuclear reactors. What percentile is this?
a.
Find the first and the third quartiles of the data.
Answer to Problem 30E
The first and the third quartiles are 2 and 18 respectively.
Explanation of Solution
Calculation:
- In recent years the number of nuclear reactors which countries had one or more reactors are given.
Three quartiles:
- The first quartile separates the lowest 25% of the observations from the other 75% of the observations. The first quartile is denoted by
- The second quartile separates the lower 50% of the observations from the other 50% of the observations. The second quartile is denoted by
- The third quartile separates the lowest 75% of the observations from the other 25% of the observations. The third quartile is denoted by
- Procedure for finding the first and the third quartile:
- Step 1: The observations should be arranged in increasing order.
- Step 2: The size of the data is n.
- For finding first quartile,
- For finding third quartile,
- Step 3: The quartile will be the average of the observation of the position L and the observation in position
- The observations are arranged in increasing order:
| 1 | 3 | 15 |
| 1 | 4 | 16 |
| 1 | 4 | 18 |
| 1 | 4 | 19 |
| 2 | 5 | 20 |
| 2 | 6 | 23 |
| 2 | 7 | 33 |
| 2 | 8 | 50 |
| 2 | 9 | 58 |
| 2 | 10 | 100 |
- The size of the data is
- For finding first quartile,
- Here, 7.5 is not a whole number, hence the 1st quartile will be the observation in the 8th position.
- From the arranged observations the first quartile is 2.
- For finding third quartile,
- Here, 22.5 is not a whole number, hence the 3rd quartile will be the observation in the 23rd position.
- From the arranged observations the third quartile is 18.
Hence, the first and the third quartiles are 2 and 18 respectively.
b.
Find the median of the data.
Answer to Problem 30E
The median of the data is 5.5.
Explanation of Solution
Calculation:
Median:
Let
The steps for finding the median:
- The all data values should be arranged in ascending order.
- If the total number of data values, n is odd, then the median will be the middle value or if n is even, then the median will be the average of middle two values.
- The observations are arranged in increasing order:
| 1 | 3 | 15 |
| 1 | 4 | 16 |
| 1 | 4 | 18 |
| 1 | 4 | 19 |
| 2 | 5 | 20 |
| 2 | 6 | 23 |
| 2 | 7 | 33 |
| 2 | 8 | 50 |
| 2 | 9 | 58 |
| 2 | 10 | 100 |
- The size of the data is
- Hence, the sample size is even. Therefore, the median is the average of 15th and 16th observation.
- From the arranged observations the median is
Thus, the median of the data is 5.5.
c.
Find the upper and lower outlier boundaries.
Answer to Problem 30E
The upper and lower outlier boundaries are –22 and 42 respectively.
Explanation of Solution
Calculation:
Interquartile range:
- The interquartile range is the difference between the third quartile and first quartile. For detecting outlier this measure can be used.
- Interquartile range can be found as,
From part (a), the first and the third quartiles are 2 and 18 respectively.
- Substitute these values in the interquartile range formula,
- Outlier boundaries:
- Lower outlier boundary is
- Upper outlier boundary is
- Where, the first quartile is denoted by
- Substitute these values in the formulae,
Thus, the upper and lower outlier boundaries are –22 and 42 respectively.
d.
Find the countries which are outlier.
Answer to Problem 30E
Japan, France and United States are the outlier countries.
Explanation of Solution
- Condition for outlier:
- If any observation is less than the lower outlier boundary, the observation will be outlier.
- If any observation is greater than the upper outlier boundary, the observation will be outlier.
From part (c), the lower and upper outlier boundaries are –22 and 42 respectively.
- The observations are arranged in increasing order:
| 1 | 3 | 15 |
| 1 | 4 | 16 |
| 1 | 4 | 18 |
| 1 | 4 | 19 |
| 2 | 5 | 20 |
| 2 | 6 | 23 |
| 2 | 7 | 33 |
| 2 | 8 | 50 |
| 2 | 9 | 58 |
| 2 | 10 | 100 |
There are 3 values which are greater than the upper outlier boundary that is,
The countries corresponding to the three values are,
| Value | Country |
| 50 | Japan |
| 58 | France |
| 100 | United States |
Hence, Japan, France and United States are the outlier countries.
e.
Draw a boxplot of the data.
Answer to Problem 30E
The boxplot is given below,
Explanation of Solution
Calculation:
- Boxplot:
Software procedure:
- Step-by-step procedure to draw a boxplot using the MINITAB software:
- Choose Graph > Boxplot.
- Choose Simple. Click OK.
- In Graph variables, enter the data of Number of reactors.
- Click OK.
Output using the MINITAB software is given below:
- From the MINITAB output, it is clear that there are three outliers in the data.
f.
Explain the shape of the distribution.
Answer to Problem 30E
The data is right skewed.
Explanation of Solution
The rule for determining the skewness from the Boxplot:
- The data is right skewed if the median is closer to the 1st quartile than the 3rd quartile or the upper whisker is longer than the lower whisker.
- The data is left skewed if the median is closer to the 3rd quartile than the 1st quartile or the lower whisker is longer than the upper whisker.
- The data is approximately symmetric if the median is the middle point of 1st quartile and the 3rd quartile or the length of the upper whisker and the lower whisker is approximately same.
From the Boxplot of part (e), is clear that the median is closer to the 1st quartile than the 3rd quartile or the upper whisker is longer than the lower whisker.
By using the above rule, it can be said that the data is right skewed.
g.
Find the 45th percentile of the data.
Answer to Problem 30E
The 45th percentile is 4.
Explanation of Solution
Calculation:
pth percentile:
The pth percentile separates the lowest p% of the observations from the highest
Procedure for finding pth percentile:
- Step 1: The observations should be arranged in increasing order.
- Step 2: The size of the data is n.
For finding pth percentile,
- Step 3: The pth percentile will be the average of the observation of the position L and the observation in position
- The observations are arranged in increasing order:
| 1 | 3 | 15 |
| 1 | 4 | 16 |
| 1 | 4 | 18 |
| 1 | 4 | 19 |
| 2 | 5 | 20 |
| 2 | 6 | 23 |
| 2 | 7 | 33 |
| 2 | 8 | 50 |
| 2 | 9 | 58 |
| 2 | 10 | 100 |
- The size of the data is
- For finding 45th percentile,
- Here, 13.5 is not a whole number, hence the 45th percentile will be the value of 14th position.
- From the arranged observations the 45th percentile is 4.
Hence, the 45th percentile is 4.
h.
Find the 88th percentile of the data.
Answer to Problem 30E
The 88th percentile is 33.
Explanation of Solution
Calculation:
- The observations are arranged in increasing order:
| 1 | 3 | 15 |
| 1 | 4 | 16 |
| 1 | 4 | 18 |
| 1 | 4 | 19 |
| 2 | 5 | 20 |
| 2 | 6 | 23 |
| 2 | 7 | 33 |
| 2 | 8 | 50 |
| 2 | 9 | 58 |
| 2 | 10 | 100 |
- The size of the data is
- For finding 88th percentile,
- Here, 26.4 is not a whole number, hence the 88th percentile will be the observation in the 27th position.
- From the arranged observations the 88th percentile is 33.
Hence, the 88th percentile is 33.
i.
Find the percentile for the given data.
Answer to Problem 30E
The value is of 82nd percentile.
Explanation of Solution
Calculation:
It is given that India has 20 nuclear reactors.
Procedure for finding the percentile for a given observation:
- The observations should be arranged in ascending order.
- If the observation is x, then the percentile of the observation is,
If the value is not a whole number the nearest whole number will be the percentile.
- The observations are arranged in increasing order:
| 1 | 3 | 15 |
| 1 | 4 | 16 |
| 1 | 4 | 18 |
| 1 | 4 | 19 |
| 2 | 5 | 20 |
| 2 | 6 | 23 |
| 2 | 7 | 33 |
| 2 | 8 | 50 |
| 2 | 9 | 58 |
| 2 | 10 | 100 |
Here,
From the observations, it is clear that there are 24 observations which are less than 20. Total number of observation is 30.
Hence, the percentile is,
- Here, 81.67 is not a whole number, hence value is of 82nd percentile.
Hence, the value is of 82nd percentile.
Want to see more full solutions like this?
Chapter 3 Solutions
Essential Statistics


 Glencoe Algebra 1, Student Edition, 9780079039897...AlgebraISBN:9780079039897Author:CarterPublisher:McGraw Hill