
Concept explainers
Videos
Ross Hopkins, president of Hopkins Hospitality, has developed the tasks, durations, and predecessor relationships in the following table for building new motels. Draw the AON network and answer the questions that follow.
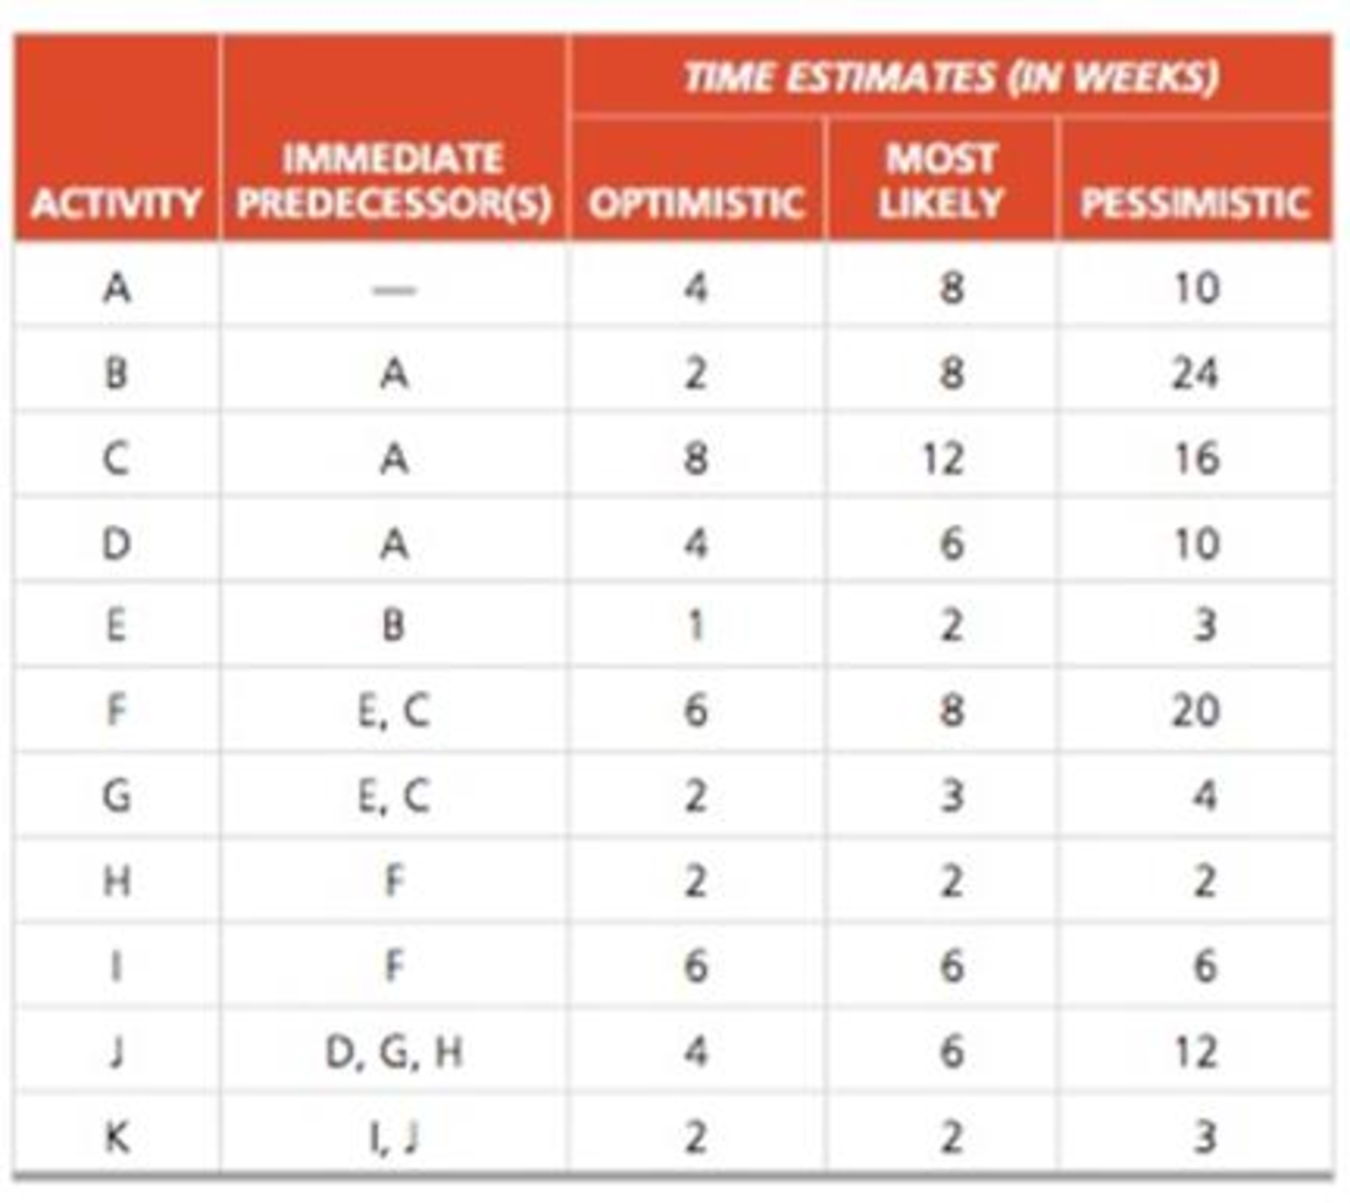
a) What is the expected (estimated) time for activity C?
b) What is the variance for activity C?
c) Based on the calculation of estimated times, what is the critical path?
d) What is the estimated time of the critical path?
e) What is the activity variance along the critical path?
f) What is the probability of completion of the project before week 36?
a)
To determine: The expected time for activity C.
Introduction: In the activity on nodes (AON) project network diagram, the nodes denote activities and the arrows show only the precedence and succession sequence.
Answer to Problem 17P
The expected time for activity C is 12 weeks.
Explanation of Solution
Given information:
| Activity | Immediate predecessor | Time estimates | ||
| Optimistic | Most likely | Pessimistic | ||
| A | 4 | 8 | 10 | |
| B | A | 2 | 8 | 24 |
| C | A | 8 | 12 | 16 |
| D | A | 4 | 6 | 10 |
| E | B | 1 | 2 | 3 |
| F | E,C | 6 | 8 | 20 |
| G | E,C | 2 | 3 | 4 |
| H | F | 2 | 2 | 2 |
| I | F | 6 | 6 | 6 |
| J | D,G,H | 4 | 6 | 12 |
| K | I,J | 2 | 2 | 3 |
Calculation of expected time for activity C:
AON project network diagram shown below, given the precedence relationships of various activities,
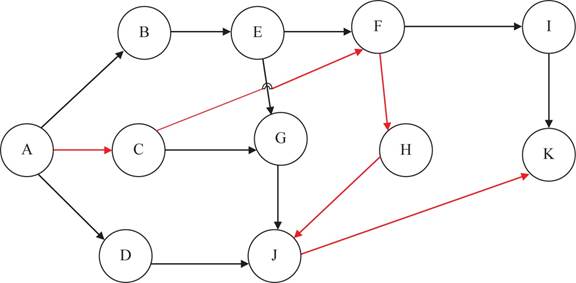
Figure 1
With the given predecessor AON diagram is constructed. To Calculate the expected time for activity C given the data that the optimistic time estimate “a” of activity C of 8 weeks, the most likely time estimate “m” of 12 weeks and the pessimistic time estimate “b” of 16 weeks using the formula.
Where ‘a’ is the optimistic time estimate, ‘m’ is the most likely time estimate and ‘b’ is the pessimistic time estimate
Substitute into the equation (1), the values of
Therefore the expected time for activity C is calcualted by adding 8, 48 and16 and dividing the sum with 6 which gives
Hence, the expected time for activity C is 12 weeks.
b)
To calculate: The variance for activity C.
Answer to Problem 17P
The variance for activity C is 1.78 weeks.
Explanation of Solution
Given information:
| Activity | Immediate predecessor | Time estimates | ||
| Optimistic | Most likely | Pessimistic | ||
| A | 4 | 8 | 10 | |
| B | A | 2 | 8 | 24 |
| C | A | 8 | 12 | 16 |
| D | A | 4 | 6 | 10 |
| E | B | 1 | 2 | 3 |
| F | E,C | 6 | 8 | 20 |
| G | E,C | 2 | 3 | 4 |
| H | F | 2 | 2 | 2 |
| I | F | 6 | 6 | 6 |
| J | D,G,H | 4 | 6 | 12 |
| K | I,J | 2 | 2 | 3 |
Calculation of variance for activity C:
Calculate the variance for activity C using the formula
Substitute in equation (2) the values of
The variance of activity C is calculated by squaring the value obtained by dividing the difference of 16 and 8 with 6 which gives the resultant as 1.28 weeks.
The variance in activity C is 1.78 weeks.
c)
To determine: The critical path.
Answer to Problem 17P
The critical path AàCàFàHàJàK.
Explanation of Solution
Given information:
| Activity | Immediate predecessor | Time estimates | ||
| Optimistic | Most likely | Pessimistic | ||
| A | 4 | 8 | 10 | |
| B | A | 2 | 8 | 24 |
| C | A | 8 | 12 | 16 |
| D | A | 4 | 6 | 10 |
| E | B | 1 | 2 | 3 |
| F | E,C | 6 | 8 | 20 |
| G | E,C | 2 | 3 | 4 |
| H | F | 2 | 2 | 2 |
| I | F | 6 | 6 | 6 |
| J | D,G,H | 4 | 6 | 12 |
| K | I,J | 2 | 2 | 3 |
Calculation of critical path:
Using equation (1) and (2)calculate the expected times and variances for all the activitiesand obtain the values shown in table.
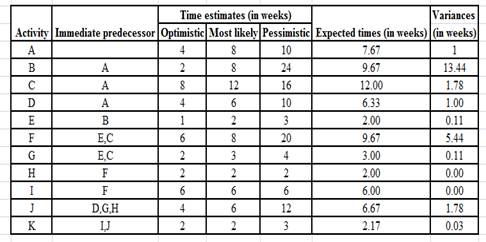
Figure 1, shows the AON diagram which gives the critical path. The critical path is AàCàFàHàJàK.
Hence, the critical path AàCàFàHàJàK.
d)
To Compute: The estimated time of the critical path.
Answer to Problem 17P
The critical path AàCàFàHàJàK which is 40.18 weeks.
Explanation of Solution
Given information:
| Activity | Immediate predecessor | Time estimates | ||
| Optimistic | Most likely | Pessimistic | ||
| A | 4 | 8 | 10 | |
| B | A | 2 | 8 | 24 |
| C | A | 8 | 12 | 16 |
| D | A | 4 | 6 | 10 |
| E | B | 1 | 2 | 3 |
| F | E,C | 6 | 8 | 20 |
| G | E,C | 2 | 3 | 4 |
| H | F | 2 | 2 | 2 |
| I | F | 6 | 6 | 6 |
| J | D,G,H | 4 | 6 | 12 |
| K | I,J | 2 | 2 | 3 |
Calculation of estimated time of the critical path:
Figure 1, shows the AON diagram which gives the critical path. The critical path is AàCàFàHàJàK.
The various paths and the expected completion times are listed in the table
| Various paths | Completion times |
| AàBàEàFàIàK | 37.18 weeks |
| AàBàEàGàJàK | 31.18 weeks |
| AàCàFàHàJàK | 40.18 weeks |
| AàCàGàJàK | 31.51 weeks |
| AàDàJàK | 22.84 weeks |
Hence, the estimated time of the critical path AàCàFàHàJàK is 40.18 weeks.
e)
To determine: The variance of the critical path.
Answer to Problem 17P
The variance of the critical path is 10.03 weeks.
Explanation of Solution
Given information:
| Activity | Immediate predecessor | Time estimates | ||
| Optimistic | Most likely | Pessimistic | ||
| A | 4 | 8 | 10 | |
| B | A | 2 | 8 | 24 |
| C | A | 8 | 12 | 16 |
| D | A | 4 | 6 | 10 |
| E | B | 1 | 2 | 3 |
| F | E,C | 6 | 8 | 20 |
| G | E,C | 2 | 3 | 4 |
| H | F | 2 | 2 | 2 |
| I | F | 6 | 6 | 6 |
| J | D,G,H | 4 | 6 | 12 |
| K | I,J | 2 | 2 | 3 |
Calculation of variance of the critical path:
The activity variance σ2along the critical path AàCàFàHàJàK is the sum of the variances of individual activities A, C, F, H, J and K.
Therefore,
The activity variance along the critical path is the sum of 1, 1.78, 5.44, 0, 1.78, 0.03 is 10.03 weeks.
Hence, the variance of the critical path is 10.03 weeks
f)
To compute: The probability of completion of the project before week 36 weeks.
Answer to Problem 17P
The probability of completion of the project before week 36 weeks is 9.34%.
Explanation of Solution
Given information:
| Activity | Immediate predecessor | Time estimates | ||
| Optimistic | Most likely | Pessimistic | ||
| A | 4 | 8 | 10 | |
| B | A | 2 | 8 | 24 |
| C | A | 8 | 12 | 16 |
| D | A | 4 | 6 | 10 |
| E | B | 1 | 2 | 3 |
| F | E,C | 6 | 8 | 20 |
| G | E,C | 2 | 3 | 4 |
| H | F | 2 | 2 | 2 |
| I | F | 6 | 6 | 6 |
| J | D,G,H | 4 | 6 | 12 |
| K | I,J | 2 | 2 | 3 |
Calculation of probability of completion of the project before week 36 weeks:
Use the normal distribution tables given that the estimated mean time is 40.18 weeks and the standard deviation is square root of 10.03 weeks.
First compute the standard deviation σ by computing the square root of 10.03 weeks.
Calculate the z value as shown below
For a z value of -1.32, the probability is 9.34%.
Therefore, there is a probability of 9.34% that the project may be completed on or before 36 weeks.
Hence, the probability of completion of the project before week 36 weeks is 9.34%.
Want to see more full solutions like this?
Chapter 3 Solutions
Pearson Etext For Principles Of Operations Management: Sustainability And Supply Chain Management -- Access Card (11th Edition)


- An architect has been awarded a contract to prepare plans for an urban renewal project. The job consists of the following activities and their estimated value. Draw a critical path arrow diagram for this project, indicate the critical path and calculate the total slack and free slack for each activity. Job Description Predecessor Expected time in days A Prepare preliminary sketches NA 2 B Outline specifications NA 1 C Prepare drawings A 3 D Write specifications A B 2 E Run prints C D 1 F Have specifications printed B D 3 G Assemble bid package E F 1arrow_forwardJanice Eliassen must complete the activities in the following table to fin ish her consulting project. a) Draw the appropriate PERT diagram.b) Find the critical path and project completion time.c) Find the probability that the project will take more than49 time periods to complete.arrow_forwardTask time estimates for the modificat ion of an assembly line at Jim Goodale's Carbondale, Illinois, factory are as follows: a) Draw the project network using AON.b) Identify the critical path.c) What is the expected project completion time?d) Draw a Gantt chart for the project.arrow_forward
- Draw the PDM network diagram for the following project, calculate the earliest and latest starting and finishing times for all activities, and hence calculate the total float, free float for each activity. Activity IPA Duration (WEEKS) WORKERS REQUIRED PER WEEK EQUIPMENT REQUIRED (hrs/WEEK) H ---- 10 5 8 I H 8 4 2 J H 6 8 6 K J 4 2 1 L J 2 6 2 M J 4 3 2 N I 4 2 0 O I 5 5 0 P I, J 5 6 6 Q L 5 2 0 R M 5 0 4 S N 3 0 4 T Q 3 0 0 U O, S 1 9 8 V K, R 5 14 8 W U 2 6 8 X V 3 6 8 Y P,W,X,T 8 14 8 Z Y 6 5 8 If there is a limit of 15 workers per week, smooth the workers loading using ES and LS histogram. Based on the proposed scheduling, plot the equipment loading histogram for the project. Independently of the above resource leveling, schedule the…arrow_forwardConsider the following activity description with associated cost data shown in Table 1. The cost data represents the total cost and should be considered linear with time. Table 1: Crash Cost Table Activity Immediate Predecessor Normal Duration (days) Normal Cost ($) Crash Duration (days) Crash Cost ($) A --- 5 50 3 150 B --- 4 40 2 200 C B 7 70 5 250 D A, C 2 20 1 50 E A, C 5 125 1 525 F B 10 80 7 290 G D 7 50 3 250 H E, F 6 60 3 180 Reduce the project duration to minimum duration and calculate the cost. Note:- Do not provide handwritten solution. Maintain accuracy and quality in your answer. Take care of plagiarism. Answer completely. You will get up vote for sure.arrow_forward9.2. Construct a Gantt chart for the project described by the following set of activities, and indicate the project completion time and the available slack for each activity:Activity Activity Predecessor Time (Weeks)1 — 32 — 73 1 24 2 55 2 66 4 17 5 4 Present a Gantt Chart that shows the timeline from start to end. This calls for drawing an A-O-N network diagram using the information given in the Table. Present a Table of Activity versus Slack (wks) and state which specific activities are on the Critical path.arrow_forward
- What's the best way to resolve this problem? Kelle Carpet and Trim installs carpet in commercial offices. Peter Kelle has been very concerned with the amount of time it took to complete several recent jobs. Some of his workers are very unreliable. A list of activities and their optimistic completion time, the most likely completion time, and the pessimistic completion time (all in days) for a new contract are given in the following table: Activity a m b Immediate Predecessor(s) Activity a m b Immediate Predecessor(s) A 3 5 9 - G 1 2 3 A, E B 4 5 6 - H 4 6 8 F C 1 2 3 - I 10 11 12 G D 7 8 9 C J 15 17 19 C E 1 3 5 B, D K 4 8 12 H, I F 5 10 15 A, E b) Activities on the critical path for the project are C - D - E - F - H - K c) For the given project, the earliest start (ES) and earliest finish (EF) are: For the given project, the latest start (LS) and latest finish (LF) are: (Round your responses to two decimal places.) Referring to the…arrow_forwardThe VOXN Cinema is installing a new system to enhance the quality of movies shown. Assume that the following table provides information on the immediate predecessor relation and time estimated for each event. a.List the possible eight events which you think essential in expanding a Cinema.b. Draw a network diagramc.find the total time required to complete the project d. List the critical events of the project. Activity immediate predecessor Time (weeks) A - 3 B - 4 C A 6 D B 2 E A 5 F C 2 G D , E 4 H F , G 5arrow_forwardCharlie is planning to open a Chinese food restaurant “Dragon Express” in Montana. The following table lists all of the activities involved in the opening of the restaurant. Charlie is able to provide his three best estimates for each activity and he wants to know when his restaurant can be open. Use POM-QM to analyze the project and answer the following questions. Activity # Activity name Predecessors Time estimates in weeks (a,m,b) 1 Select location and obtain financing - 2,4,8 2 Rent negotiation and sign paper work 1 1,2,2 3 Cleaning and renovation of the resturant 2 4,6,8 4 Design resutrant menu - 1,1,1 5 Order and recieve equipment and other necessities 2,4 4,8,12 6 Install equipment 3,5 1,1,1 7 Hire employees 6 1,2,2 8 Final examination 7 1,2,3 Based on the result of POM-QM, the expected completion time of the project is (type number only, no text, no decimals) Based on the result of POM-QM, the standard deviation of the project completion time is…arrow_forward
- We are the project manager for an IT project in our company. We identified the following top-level project tasks and estimated durations to standup a small test lab for the project: Identify test lab building/space requirements and possible locations(8days) Select best location for lab (1day) Once the best location is selected, immediately start the next two tasks: Prepare lab space with power and cabling (3days) Identify/procure required specialized test lab hardware/software(5) Once the lab space is prepared, install/check out available infrastructure hardware/software(1day). Once the specialized software/hardware is received and the infrastructure hardware/software is installed/checked out, install/checkout specialized software/hardware (2days) Once all tasks are completed, conduct the final inspection (1 day). Let's create a PERT/CPM chart for this project and identify the overall project duration and critical path.arrow_forwardThe activities described by the following table are given for the Howard Corporation in Kansas: a) Draw the appropriate AON PERT diagram for J.C. Howard's management team.b) Find the critical path.c) What is the project completion time?arrow_forwardA senior MIS design class project team has developed the following schedule of activities for their project, using their best estimate of completion times. Both written and oral reports are required. Draw the project network. What is the minimum time required to finish the project? State the critical path. Activity Time (week) Immediate Predecessor A. Find client 4 --- B. Write prospectus 2 A C. Obtain approval from client and professor 3 B D. Complete programming 12 C E. Do industry background research 10 --- F. Write final paper 6 D, E G. Write oral report 5 D, Earrow_forward
 Practical Management ScienceOperations ManagementISBN:9781337406659Author:WINSTON, Wayne L.Publisher:Cengage,
 Operations ManagementOperations ManagementISBN:9781259667473Author:William J StevensonPublisher:McGraw-Hill Education
 Operations and Supply Chain Management (Mcgraw-hi...Operations ManagementISBN:9781259666100Author:F. Robert Jacobs, Richard B ChasePublisher:McGraw-Hill Education
 Purchasing and Supply Chain ManagementOperations ManagementISBN:9781285869681Author:Robert M. Monczka, Robert B. Handfield, Larry C. Giunipero, James L. PattersonPublisher:Cengage Learning
 Production and Operations Analysis, Seventh Editi...Operations ManagementISBN:9781478623069Author:Steven Nahmias, Tava Lennon OlsenPublisher:Waveland Press, Inc.