
Videos
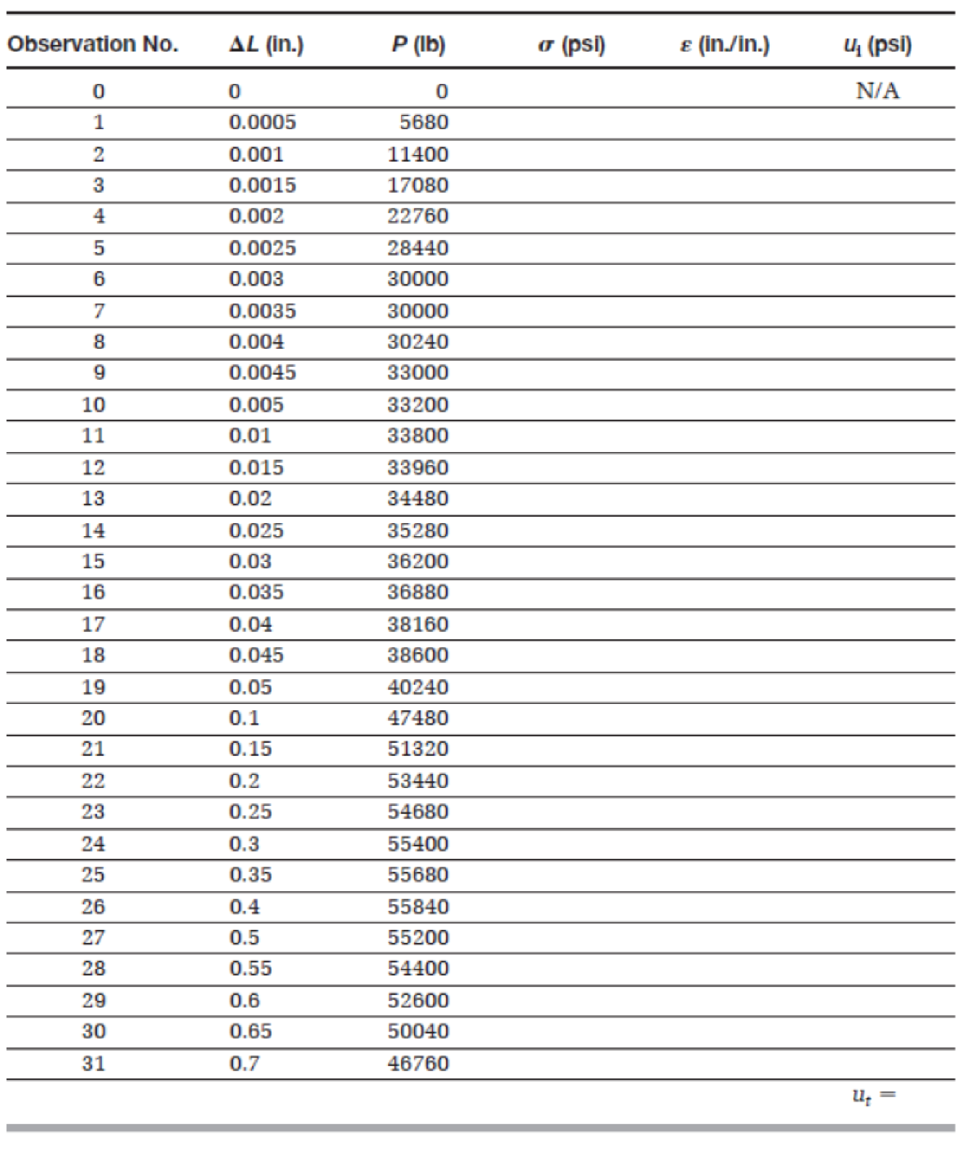
An engineering technician performed a tension test on an A36 mild steel specimen to fracture. The original cross-sectional area of the specimen is 0.25 in2 and the gauge length is 4.0 in. The information obtained from this experiment consists of applied tensile load (P) and increase in length (∆L) The results are tabulated in Table P3.44. Using a spreadsheet program, complete the table by calculating the engineering stress (σ) and the engineering strain (ε). Determine the toughness of the material (ut) by calculating the area under the stress-strain curve, namely,
where εf is the strain at fracture. The preceding integral can be approximated numerically using a trapezoidal integration technique:
TABLE P3.44
Want to see the full answer?
Check out a sample textbook solution
Chapter 3 Solutions
Materials for Civil and Construction Engineers (4th Edition)


- A tensile test was performed on a metal specimen having a circular cross section with a diameter of 1 2 inch. The gage length (the length over which the elongation is measured) is 2 inches. For a load 13.5 kips, the elongation was 4.6610 3 inches. If the load is assumed to be within the linear elastic rang: of the material, determine the modulus of elasticity.arrow_forwardThe results of a tensile test are shown in Table 1.5.2. The test was performed on a metal specimen with a circular cross section. The diameter was 3 8 inch and the gage length (The length over which the elongation is measured) was 2 inches. a. Use the data in Table 1.5.2 to produce a table of stress and strain values. b. Plot the stress-strain data and draw a best-fit curve. c. Compute the, modulus of elasticity from the initial slope of the curve. d. Estimate the yield stress.arrow_forwardA tensile test was performed on a metal specimen having a circular cross section with a diameter 0. 510 inch. For each increment of load applied, the strain was directly determined by means of a strain gage attached to the specimen. The results are, shown in Table: 1.5.1. a. Prepare a table of stress and strain. b. Plot these data to obtain a stress-strain curve. Do not connect the data points; draw a best-fit straight line through them. c. Determine the modulus of elasticity as the slope of the best-fit line.arrow_forward
- A tensile test was performed on a metal specimen having a circular cross section with a diameter of 0.510 inch. For each increment of load applied, the strain was directly determined by means of a strain gage attached to the specimen. The results are shown in Table 1.1.a. Prepare a table of stress and strainb. Plot these data to obtain a stress-strain curve. Do not connect the data points; draw a best-fit straight line through them.c. Determine the modulus of elasticity as the slope of the best-fit lineLoad (Ib)Strain × 106 (in./in.)0025037.150070.31000129.11500230.12000259.42500372.43000457.73500586.5arrow_forwardA cylindrical specimen of stainless steel having an initial diameter of 12.8?? and initial length of 50.8?? is pulled in tension. Use the data provided below to a) Plot the data as engineering stress versus engineering strain using excel or similar software. b) Compute the modulus of elasticity. c) Determine the yield strength at a strain offset of 0.002. d) Determine the tensile strength of this alloy. e) What is the approximate ductility, in percent elongation? f) Compute the modulus of resilience. Load (?) Length (??) 0 50.800 12,700 50.825 25,400 50.851 38,100 50.876 50,800 50.902 76,200 50.952 89,100 51.003 92,700 51.054 102,500 51.181 107,800 51.308 119,400 51.562 128,300 51.816 149,700 52.832 159,000 53.848 160,400 54.356 159,500 54.864 151,500 55.880 124,700 56.642 Fracturearrow_forwardA 19-mm reinforcing steel bar and a gauge length of 75 mm was subjected to tension, with the results shown in Table Using a computer spreadsheet program, plot the stress–strain relationship. From the graph, determine the Young’s modulus of the steel and the deformation corresponding to a 150-kN load.arrow_forward
- A tensile test was performed on a metal specimen having a circular cross section with a diameter of 1/2 inch. the gage lenght ( the lenght over which the elongation is measured ) is 2 inches. for a load 13.5 kips, the elongation was 4.66x10^-3 inches. if the load is assumed to be with in the linear elastic range of the material , determine the modulus of elasticityarrow_forwardThe data shown in the table were obtained from a tensile test of a metal specimen with a rectangular cross-section of 0.2 in.? in area and a gage length (the length over which the elongation is measured) of 2.000 inches. a. Generate a table of stress and strain values. b. Plot these values and draw a best-fit line to obtain a stress-strain curve. c. Determine the modulus of elasticity from the slope of the linear portion of the curve. d. Estimate the value of the proportional limit. e. Use the 0.2% offset method to determine the yield stress.arrow_forwardA tensile test was performed on a metal specimen with a diameter of 1⁄2 inch and a gage length (the length over which the elongation is measured) of 4 inches. The data were plotted on a load-displacement graph, P vs. ∆L. A best-fit line was drawn through the points, and the slope of the straight-line portion was calculated to be P y∆L 5 1392 kips yin. What is the modulus of elasticity?arrow_forward
- An aluminum alloy bar with a radius of 7 mm was subjected to tension until fracture and produced results shown in Table P4.3. a. Using a spreadsheet program, plot the stress–strain relationship. b. Calculate the modulus of elasticity of the aluminum alloy. c. Determine the proportional limit. d. What is the maximum load if the stress in the bar is not to exceed the proportional limit? e. Determine the 0.2% offset yield strength. f. Determine the tensile strength. g. Determine the percent of elongation at failure.arrow_forwardThe strain rosette shown in the figure was used to obtain the following normal strain data on a piece of aluminum. The plate has a modulus of elasticity of 10,000 ksi and a Poisson’s Ratio of 0.35. The strain readings were εa = 600 με, εb = 900 με, and εc = 120 με. Note: 1 με = 1 X 10⁻⁶ in/in. a) Calculate the normal strain in the x- and y- directions (εx and εy) and the shear strain (γxy) using a system of equations. b) Calculate the normal stress σx in ksi. Clearly indicate Tension (T) or Compression (C). Note: even though the normal stress in the z-direction is zero, but the normal strain in the z-direction is NOT zero. [Ans. to Check σx = 7.18 ksi (T)] c) Calculate the normal stress σy in ksi. Clearly indicate Tension (T) or Compression (C). d) Calculate the shear stress τxy in ksi.arrow_forwardOn the stress-strain diagram of a steel bar, show and explain the following: proportional limit, yield stress, ultimate stress, yield strain, and modulus of elasticity.arrow_forward
 Steel Design (Activate Learning with these NEW ti...Civil EngineeringISBN:9781337094740Author:Segui, William T.Publisher:Cengage Learning
 Materials Science And Engineering PropertiesCivil EngineeringISBN:9781111988609Author:Charles GilmorePublisher:Cengage Learning