
Statistics for Business and Economics (13th Edition)
13th Edition
ISBN: 9780134648385
Author: MCCLAVE
Publisher: PEARSON
expand_more
expand_more
format_list_bulleted
Concept explainers
Videos
Textbook Question
Chapter 3.1, Problem 3.15ACI
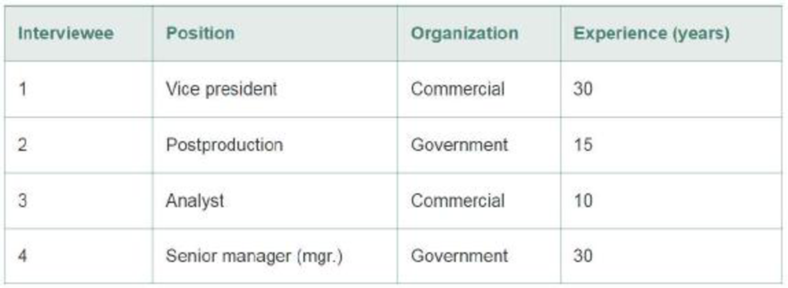
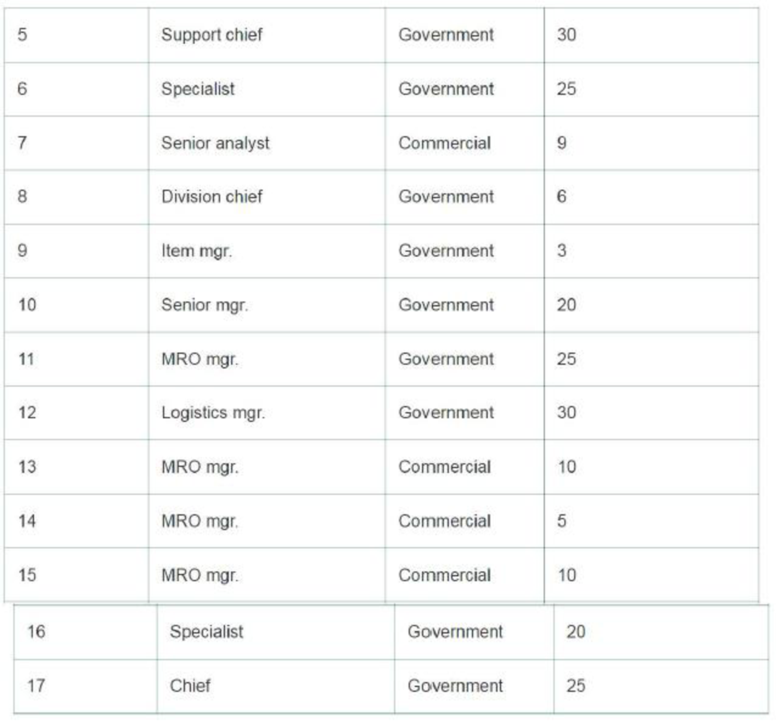
Performance-based logistics. Refer to the Journal of Business Logistics (Vol. 36, 2015) study of performance-based logistics (PBL) strategies, Exercise 1.15 (p. 25). Recall that the study was based on the opinions of a sample of 17 upper-level employees of the U.S. Department of Defense and its suppliers. The current position (e.g., vice president, manager), type of organization (commercial or government), and years of experience for each employee interviewed are listed below. Suppose we randomly select one of these interviewees for more in-depth questioning on PBL strategies.
- a. What is the probability that the interviewee works for a government organization?
- b. What is the probability that the interviewee has at least 20 years of experience?
Expert Solution & Answer
Want to see the full answer?
Check out a sample textbook solution
Students have asked these similar questions
In the book Business Research Methods (5th ed.), Donald R. Cooper and C. William Emory discuss studying the relationship between on-the-job accidents and smoking. Cooper and Emory describe the study as follows:
Suppose a manager implementing a smoke-free workplace policy is interested in whether smoking affects worker accidents. Since the company has complete reports of on-the-job accidents, she draws a sample of names of workers who were involved in accidents during the last year. A similar sample from among workers who had no reported accidents in the last year is drawn. She interviews members of both groups to determine if they are smokers or not.
The sample results are given in the following table.
On-the-Job Accident
Smoker
Yes
No
Row Total
Heavy
12
5
17
Moderate
9
10
19
Nonsmoker
13
17
30
Column total
34
32
66
Expected counts are below observed counts
Accident
No Accident
Total
Heavy
12
5
17
8.76
8.24…
The Behavioral Risk Factor Surveillance System (BRFSS) is an annual telephone survey designed to identify risk factors in the adult population and reportemerging health trends. The following table summarizes two variables for the respondents: health status and health coverage, which describes whether each respondent had health insurance:
Health Status
Excellent
Very Good
Good
Fair
Poor
Total
Health
No
459
727
854
385
99
2524
Coverage
Yes
4198
6245
4821
1634
578
17476
Total
4657
6972
5675
2019
677
20000
If we draw one individual at random, what is the probability that the respondent has health coverage if they have good health?
Answer with a decimal rounded to 3 decimal places.
In the COVID-19 data set, there are several questions that participants answer about the reactions of their government to the pandemic, as well as questions about their own well-being, in terms of measures of distress, such as anxiety and depression. This data was collected quite early in the pandemic, near the beginning of the first wave in late March.
One might ask whether how one viewed their government might affect one's concerns about the health of their family and themselves. What type of procedure might you use to see whether there was an association between attitudes towards governtment and worries about health?
Group of answer choices
Correlation
Related Samples t Test
Chi-Square Goodness of Fit Test
Oneway ANOVA
Chapter 3 Solutions
Statistics for Business and Economics (13th Edition)
Ch. 3.1 - An experiment results in one of the following...Ch. 3.1 - The diagram below describes the sample space of a...Ch. 3.1 - The sample space for an experiment contains five...Ch. 3.1 - Compute each of the following: a. (94) b. (72) c....Ch. 3.1 - Compute the number of ways you can select n...Ch. 3.1 - Two fair dice are tossed, and the face on each die...Ch. 3.1 - Two marbles are drawn at random and without...Ch. 3.1 - Use the applet Simulating the Probability of...Ch. 3.1 - Use the applet Simulating the Probability of a...Ch. 3.1 - Cable TV subscriptions and "cord cutters." Refer...
Ch. 3.1 - Do social robots walk or roll? Refer to the...Ch. 3.1 - Colors of MMs candies. When they were first...Ch. 3.1 - Male nannies. In a survey conducted by the...Ch. 3.1 - Working on summer vacation. Is summer vacation a...Ch. 3.1 - Mobile access to social media. The Marketing...Ch. 3.1 - Performance-based logistics. Refer to the Journal...Ch. 3.1 - Who prepares your tax return? As part of a study...Ch. 3.1 - Consumer recycling behavior. Refer to the Journal...Ch. 3.1 - Museum management. Refer to the Museum Management...Ch. 3.1 - USDA chicken inspection. The U.S. Department of...Ch. 3.1 - Jamming attacks on wireless networks. Refer to the...Ch. 3.1 - Randomization in a study of TV commercials....Ch. 3.1 - Jai-alai bets. The Quinella bet at the paramutual...Ch. 3.1 - Investing in stocks. From a list of 15 preferred...Ch. 3.1 - Highest-rated car brands. Consumer Reports 2015...Ch. 3.1 - Volkswagen emissions scandal. Refer to the...Ch. 3.1 - Drug testing of firefighters. Hillsborough County...Ch. 3.1 - Odds of winning a race. Handicappers for greyhound...Ch. 3.1 - Lead bullets as forensic evidence. Chance (Summer...Ch. 3.1 - Making your vote count. Democratic and Republican...Ch. 3.4 - Suppose P (A) = A, P(B) = 7, and P (A B) = 3....Ch. 3.4 - A fair coin is tossed three times, and the events...Ch. 3.4 - A pair of fair dice is tossed. Define the...Ch. 3.4 - Consider the Venn diagram below, where P(E1) =...Ch. 3.4 - Consider the Venn diagram in the next column,...Ch. 3.4 - Prob. 3.35LMCh. 3.4 - Prob. 3.36LMCh. 3.4 - Use the applets Simulating the Probability of...Ch. 3.4 - Prob. 3.4AECh. 3.4 - Do social robots walk or roll? Refer to the...Ch. 3.4 - Firefighter glove sizing. Human Factors (December...Ch. 3.4 - Study of analysts' forecasts. The Journal of...Ch. 3.4 - Problems at major companies The Organization...Ch. 3.4 - Scanning errors at Walmart. The National Institute...Ch. 3.4 - Social networking Web sites in the United Kingdom....Ch. 3.4 - Paying monthly bills online. Do most people pay...Ch. 3.4 - Fuzzy logic in supply chain management. A branch...Ch. 3.4 - Study of why EMS workers leave the job. An...Ch. 3.4 - Stock market participation and IQ. The Journal of...Ch. 3.4 - Cell phone handoff behavior. A "handoff' is a term...Ch. 3.4 - Guilt in decision making. The effect of guilt...Ch. 3.4 - Likelihood of a tax return audit. At the beginning...Ch. 3.4 - Prob. 3.50ACACh. 3.4 - Encoding variability in software. At the 2012 Gulf...Ch. 3.6 - For two events, A and B, P (A) .4, P (B) .2, and...Ch. 3.6 - For two events, A and B, P (A) = .4, P (B) = .2,...Ch. 3.6 - An experiment results in one of three mutually...Ch. 3.6 - For two independent events, A and B, P (A) = .4...Ch. 3.6 - Two fair coins are tossed, and the following...Ch. 3.6 - Consider the experiment depicted by the Venn...Ch. 3.6 - Two fair dice are tossed, and the following events...Ch. 3.6 - A sample space contains six sample points and...Ch. 3.6 - Use the applet Simulating the Probability of...Ch. 3.6 - On-the-job arrogance and task performance. Human...Ch. 3.6 - World's largest public companies. Forbes (May 6,...Ch. 3.6 - Guilt in decision making. Refer to the Journal of...Ch. 3.6 - Blood diamonds. According to Global Research News...Ch. 3.6 - Do social robots walk or roll? Refer to the...Ch. 3.6 - Shopping with a smartphone. Each year, United...Ch. 3.6 - Identity theft victims. According to The National...Ch. 3.6 - Study of why EMS workers leave the job. Refer to...Ch. 3.6 - Working on summer vacation. Refer to the Harris...Ch. 3.6 - Stock market participation and IQ. Refer to The...Ch. 3.6 - Prob. 3.70ACICh. 3.6 - Ambulance response time. Geographical Analysis...Ch. 3.6 - Working mothers with children. The U S Census...Ch. 3.6 - Firefighters' use of gas detection devices. Two...Ch. 3.6 - Wine quality and soil. The Journal of Wine...Ch. 3.6 - Are you really being served red snapper? Red...Ch. 3.6 - Random shuffling of songs on Spotify. Spotify is a...Ch. 3.6 - Forensic evidence in a criminal court case. In our...Ch. 3.6 - Prob. 3.78ACACh. 3.6 - Prob. 3.79ACACh. 3.6 - Encryption systems with erroneous ciphertexts. In...Ch. 3.7 - Suppose the events B1 and B2 are mutually...Ch. 3.7 - Prob. 3.82LMCh. 3.7 - Prob. 3.83LMCh. 3.7 - Confidence of feedback information for improving...Ch. 3.7 - Fingerprint expertise. A study published in...Ch. 3.7 - Tests for Down syndrome. Currently, there are...Ch. 3.7 - Fish contaminated by a plants toxic discharge....Ch. 3.7 - Errors in estimating job costs. A construction...Ch. 3.7 - Mining for dolomite. Dolomite is a valuable...Ch. 3.7 - Nondestructive evaluation. Nondestructive...Ch. 3.7 - Drug testing in the workplace. In Canada, the...Ch. 3.7 - Intrusion detection systems. The Journal of...Ch. 3.7 - Forensic analysis of JFK assassination bullets....Ch. 3 - Which of the following pairs of events are...Ch. 3 - A sample space consists of four sample points,...Ch. 3 - For two events A and B, suppose P (A) = .7, P (B)...Ch. 3 - A and B are mutually exclusive events, with P (A)...Ch. 3 - Two events, A and B , are independent, with P (A) ...Ch. 3 - Prob. 3.99LMCh. 3 - Prob. 3.100LMCh. 3 - The Venn diagram below illustrates a sample space...Ch. 3 - Use the applet entitled Random Numbers to generate...Ch. 3 - Find the numerical value of a. 6! b. (109) c....Ch. 3 - Management system failures. Refer to the Process...Ch. 3 - Workers unscheduled absence survey. Each year CCH,...Ch. 3 - Ownership of small businesses. According to the...Ch. 3 - Condition of public school facilities. The...Ch. 3 - New car crash tests. Refer to the National Highway...Ch. 3 - Speeding linked to fatal car crashes. According to...Ch. 3 - Choosing portable grill displays. Consider a study...Ch. 3 - Inactive oil and gas structures. U.S. federal...Ch. 3 - Is a product green? A green product (e.g., a...Ch. 3 - Monitoring quality of power equipment. Mechanical...Ch. 3 - Appeals of federal civil trials. The Journal of...Ch. 3 - Characteristics of a new product. The long-run...Ch. 3 - Testing a watch manufacturers claim. A...Ch. 3 - Ranking razor blades. The corporations in the...Ch. 3 - Reliability of gas station air gauges. Tire and...Ch. 3 - Which events are independent? Use your intuitive...Ch. 3 - Home modifications for wheelchair users. The...Ch. 3 - World Cup soccer match draws. Every 4 years the...Ch. 3 - Chance of an Avon sale. The probability that an...Ch. 3 - Drug testing in athletes. When Olympic athletes...Ch. 3 - Profile of a sustainable farmer. Sustainable...Ch. 3 - Evaluating the performance of quality inspectors....Ch. 3 - Using game simulation to teach a course. In...Ch. 3 - Patient medical instruction sheets. Physicians and...Ch. 3 - Detecting traces of TNT. University of Florida...Ch. 3 - The three-dice gambling problem. According to...Ch. 3 - Scrap rate of machine parts. A press produces...Ch. 3 - Chance of winning at craps. A version of the dice...Ch. 3 - Chance of winning blackjack. Blackjack, a favorite...Ch. 3 - Software defects in NASA spacecraft instrument...Ch. 3 - Lets Make a Deal. Marilyn vos Savant, who is...Ch. 3 - Flawed Pentium computer chip. In October 1994, a...Ch. 3 - Exit polls are conducted in selected locations as...Ch. 3 - Define events A and B as follows: A: {Purchase...Ch. 3 - Now define events A and B in this manner: A:...
Knowledge Booster


Learn more about
Need a deep-dive on the concept behind this application? Look no further. Learn more about this topic, statistics and related others by exploring similar questions and additional content below.Similar questions
- A landscaping company has collected data on home values (in thousands of $) and expenditures (in thousands of $) on landscaping with the hope of developing a predictive model to help marketing to potential new clients. Suppose the following table represents data for 14 households. HomeValue($1,000) LandscapingExpenditures($1,000) 243 8.2 322 10.7 199 12.3 340 16.3 300 15.7 400 18.8 800 23.5 200 9.5 522 17.5 548 22.0 438 12.2 463 13.5 635 17.8 357 13.8 a. Use the least squares method to develop the estimated regression equation. (Let x = home value (in thousands of $), and let y = landscaping expenditures (in thousands of $). Round your numerical values to five decimal places.) b. Use the equation estimated in part (b) to predict the landscaping expenditures (in $) for a home valued at $275,000. (Round your answer to the nearest dollar.)arrow_forwardA research group is interested in the relationship between exposure to mold in households after a major hurricane and the onset of acute respiratory illness in children. Suppose an observational study is conducted over 10 years following the natural disaster and the following two-by-two table was created in order to address the relationship between exposure and outcome. Acute Respiratory Illness No Acute Respiratory Illness Total Mold 378 156 534 No Mold 73 260 333 Total 451 416 867 Calculate the incidence of acute respiratory illness in the exposed and unexposed. Calculate the relative risk for ARI due to exposure in this study Interpret your findings from part Barrow_forwardBased on a survey of 12,344 U.S. college students and 6,729 Canadian college students, Kuo, Adlaf, Lee, Gliksman, Demers, and Wechsler (2002) report that alcohol use is more common among Canadian than U.S. students, but heavy drinking (five or more drinks in a row for males, four or more for females) is significantly higher among U.S. students than Canadian students. Is this an example of a survey research design?arrow_forward
- A landscaping company has collected data on home values (in thousands of $) and expenditures (in thousands of $) on landscaping with the hope of developing a predictive model to help marketing to potential new clients. Suppose the following table represents data for 14 households. HomeValue($1,000) LandscapingExpenditures($1,000) 241 8.2 322 10.7 199 12.1 340 16.1 300 15.7 400 18.8 800 23.5 200 9.5 522 17.5 548 22.0 436 12.2 463 13.5 635 17.8 357 13.8 (a) Develop a scatter diagram with home value as the independent variable. A scatter diagram has a horizontal axis labeled "Home Value ($1,000)" with values from 0 to 900 and a vertical axis labeled "Landscaping Expenditures ($1,000)" with values from 0 to 25. The scatter diagram has 14 points. A pattern goes down and right from (199, 21.8) to (800, 6.5). The points are scattered moderately from the pattern. A scatter diagram has a horizontal axis labeled "Landscaping Expenditures ($1,000)" with…arrow_forwardIn a 1993 article in Accounting and Business Research, Meier, Alam, and Pearson studied auditor lobbying on several proposed U.S. accounting standards that affect banks and savings and loan associations. As part of this study, the authors investigated auditors’ positions regarding proposed changes in accounting standards that would increase client firms’ reported earnings. It was hypothesized that auditors would favor such proposed changes because their clients’ managers would receive higher compensation (salary, bonuses, and so on) when client earnings were reported to be higher. Table (below) summarizes auditor and client positions (in favor or opposed) regarding proposed changes in accounting standards that would increase client firms’ reported earnings. Here the auditor and client positions are cross-classified versus the size of the client firm. (a) Auditor Positions LargeFirms SmallFirms Total In Favor 18 125 143 Opposed 20 14 34 Total 38 139 177 (b) Client…arrow_forwardIn a 1993 article in Accounting and Business Research, Meier, Alam, and Pearson studied auditor lobbying on several proposed U.S. accounting standards that affect banks and savings and loan associations. As part of this study, the authors investigated auditors’ positions regarding proposed changes in accounting standards that would increase client firms’ reported earnings. It was hypothesized that auditors would favor such proposed changes because their clients' managers would receive higher compensation (salary, bonuses, and so on) when client earnings were reported to be higher. Table (below) summarizes auditor positions regarding proposed changes in accounting standards that would decrease client firms’ reported earnings. LargeFirms SmallFirms Total In Favor 27 152 179 Opposed 29 154 183 Total 56 306 362 Click here for the Excel Data File Determine whether the…arrow_forward
- In a 1993 article in Accounting and Business Research, Meier, Alam, and Pearson studied auditor lobbying on several proposed U.S. accounting standards that affect banks and savings and loan associations. As part of this study, the authors investigated auditors’ positions regarding proposed changes in accounting standards that would increase client firms’ reported earnings. It was hypothesized that auditors would favor such proposed changes because their clients’ managers would receive higher compensation (salary, bonuses, and so on) when client earnings were reported to be higher. Table (below) summarizes auditor and client positions (in favor or opposed) regarding proposed changes in accounting standards that would increase client firms’ reported earnings. Here the auditor and client positions are cross-classified versus the size of the client firm. LargeFirms SmallFirms Total In Favor 13 130 143 Opposed 10 24 34 Total 23 154 177 LargeFirms SmallFirms Total…arrow_forwardWhat is the step-step solution to this problem? Does posting calorie content for menu items affect people’s choices in fast-food restaurants? According to results obtained by Elbel, Gyamfi, and Kersh (2011), the answer is no. The researchers monitored the calorie content of food purchases for children and adolescents in four large fast-food chains before and after mandatory labeling began in New York City. Although most of the adolescents reported noticing the calorie labels, apparently the labels had no effect on their choices. Data similar to the results obtained show an average of M = 786 calories per meal with s = 85 for n = 100 children and adolescents before the labeling, compared to an average of M = 772 calories with s = 91 for a similar sample of n = 100 after the mandatory posting. Use a two-tailed test with a α .05 to determine whether the mean number of calories after the posting is significantly different than before calorie content was posted. 3. Calculate r 2 to…arrow_forwardJensen Tire & Auto is in the process of deciding whether to purchase a maintenance contract for its new computer wheel alignment and balancing machine. Managers feel that maintenance expense should be related to usage, and they collected the following information on weekly usage (hours) and annual maintenance expense (in hundreds of dollars). Weekly Usage(hours) AnnualMaintenanceExpense 13 17.0 10 22.0 20 30.0 28 37.0 32 47.0 17 30.5 24 32.5 31 39.0 40 51.5 38 40.0 test statistic is 6.90 Find the p-value. (Round your answer to three decimal places.) p-value = State your conclusion. Reject H0. We conclude that the relationship between weekly usage (hours) and annual maintenance expense (in hundreds of dollars) is significant. Do not reject H0. We conclude that the relationship between weekly usage (hours) and annual maintenance expense (in hundreds of dollars) is significant. Reject H0. We cannot conclude that the relationship between weekly usage…arrow_forward
- Reviewers from the Oregon Evidence-Based Practice Center at the Oregon Health and Science University investigated the effectiveness of prescription drugs in assisting people to fall asleep and stay asleep (source: S. Carson, M.S. McDonagh, et al., “Drug class review: Newer drugs for insomnia,” Oregon Health and Science University, 2008, http://www.ncbi.nlm.nih.gov). Suppose a study of two drugs, Sonata and Ambien, was conducted and the resulting data are contained in a file titled Shuteye. The samples reflect an experiment in which individuals were randomly given the two brands of pills on separate evenings. Their time spent sleeping was recorded for each of the brands of sleeping pills. (A) Does the experiment seem to have dependent or independent samples? Explain your reasoning. (B) Do the data indicate that there is a statistical difference in the mean time spent sleeping for people using the two drugs? Test using alpha = 0.02. Conduct a statistical procedure to determine this. (C)…arrow_forwardA researcher is interested in examining the relationship between ACT scores and college GPA. What can youconclude from the following data? Based on the interpretation framework discussed in class, how strong is thiscorrelation? Discuss the relative movement of the variables Participant ACT GPA1 24 2.752 28 3.253 29 3.504 35 3.755 34 4.006 30 3.807 29 2.608 27 2.689 31 3.36arrow_forwardA U.S. study published in The American Journal of Preventive Medicine compared state-level prevalence of firearm ownership in 2002 with state-level rates of firearm assault and firearm robbery in the subsequent year. The investigators found a positive association - meaning that states with higher prevalence of firearm ownership also tended to be the states with higher rates of firearm assault. Which design best describes this study? a)Observational cohort study b)Randomized trial c)Case-control study d)Ecological studyarrow_forward
arrow_back_ios
SEE MORE QUESTIONS
arrow_forward_ios
Recommended textbooks for you
 MATLAB: An Introduction with ApplicationsStatisticsISBN:9781119256830Author:Amos GilatPublisher:John Wiley & Sons Inc
 Probability and Statistics for Engineering and th...StatisticsISBN:9781305251809Author:Jay L. DevorePublisher:Cengage Learning
 Statistics for The Behavioral Sciences (MindTap C...StatisticsISBN:9781305504912Author:Frederick J Gravetter, Larry B. WallnauPublisher:Cengage Learning
 Elementary Statistics: Picturing the World (7th E...StatisticsISBN:9780134683416Author:Ron Larson, Betsy FarberPublisher:PEARSON
 The Basic Practice of StatisticsStatisticsISBN:9781319042578Author:David S. Moore, William I. Notz, Michael A. FlignerPublisher:W. H. Freeman
 Introduction to the Practice of StatisticsStatisticsISBN:9781319013387Author:David S. Moore, George P. McCabe, Bruce A. CraigPublisher:W. H. Freeman
MATLAB: An Introduction with Applications
Statistics
ISBN:9781119256830
Author:Amos Gilat
Publisher:John Wiley & Sons Inc
Probability and Statistics for Engineering and th...
Statistics
ISBN:9781305251809
Author:Jay L. Devore
Publisher:Cengage Learning
Statistics for The Behavioral Sciences (MindTap C...
Statistics
ISBN:9781305504912
Author:Frederick J Gravetter, Larry B. Wallnau
Publisher:Cengage Learning
Elementary Statistics: Picturing the World (7th E...
Statistics
ISBN:9780134683416
Author:Ron Larson, Betsy Farber
Publisher:PEARSON
The Basic Practice of Statistics
Statistics
ISBN:9781319042578
Author:David S. Moore, William I. Notz, Michael A. Fligner
Publisher:W. H. Freeman
Introduction to the Practice of Statistics
Statistics
ISBN:9781319013387
Author:David S. Moore, George P. McCabe, Bruce A. Craig
Publisher:W. H. Freeman
Probability & Statistics (28 of 62) Basic Definitions and Symbols Summarized; Author: Michel van Biezen;https://www.youtube.com/watch?v=21V9WBJLAL8;License: Standard YouTube License, CC-BY
Introduction to Probability, Basic Overview - Sample Space, & Tree Diagrams; Author: The Organic Chemistry Tutor;https://www.youtube.com/watch?v=SkidyDQuupA;License: Standard YouTube License, CC-BY