
Statistics for Business and Economics (13th Edition)
13th Edition
ISBN: 9780134648385
Author: MCCLAVE
Publisher: PEARSON
expand_more
expand_more
format_list_bulleted
Videos
Textbook Question
Chapter 3.1, Problem 3.20ACI
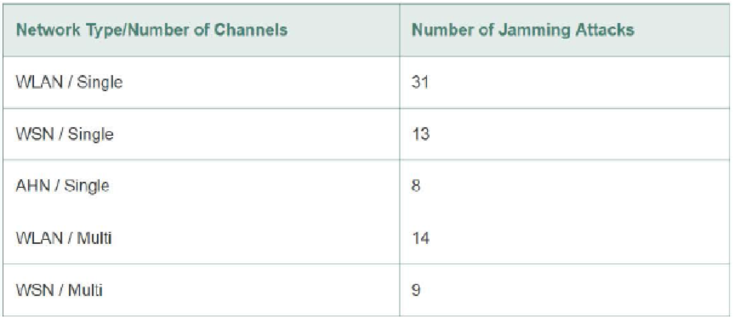
Jamming attacks on wireless networks. Refer to the International Journal of Production Economics (Vol. 172, 2016) study of U.S. military jamming attacks on wireless networks used by terrorists, Exercise 2.8 (p. 49). Recall that 80 recent jamming attacks were classified according to network type (WLAN, WSN, or AHN) attacked and number of channels (single- or multi-channel) of the network. The results are reproduced in the accompanying table.
- a. Find the probability that a recent jamming attack involved a single-channel network.
- b. Find the probability that a recent jamming attack involved a WLAN network.

Expert Solution & Answer

Trending nowThis is a popular solution!

Students have asked these similar questions
Jensen Tire & Auto is in the process of deciding whether to purchase a maintenance contract for its new computer wheel alignment and balancing machine. Managers feel that maintenance expense should be related to usage, and they collected the following information on weekly usage (hours) and annual maintenance expense (in hundreds of dollars).
Weekly Usage(hours)
AnnualMaintenanceExpense
13
17.0
10
22.0
20
30.0
28
37.0
32
47.0
17
30.5
24
32.5
31
39.0
40
51.5
38
40.0
test statistic is 6.90
Find the p-value. (Round your answer to three decimal places.)
p-value =
State your conclusion.
Reject H0. We conclude that the relationship between weekly usage (hours) and annual maintenance expense (in hundreds of dollars) is significant.
Do not reject H0. We conclude that the relationship between weekly usage (hours) and annual maintenance expense (in hundreds of dollars) is significant.
Reject H0. We cannot conclude that the relationship between weekly usage…
The UWI Open Campus has commissioned a study to determine how student will perform in ECON3080 based on the hours of studying each semester. Students are separated by gender and the results of the study are given below:
Males
Females
Hours Studying
ECON3080
Grade
Hours Studying
ECON3080
Grade
377
92
182
51
280
100
99
41
187
99
44
38
225
62
387
90
157
91
200
75
280
99
331
48
80
32
263
78
374
88
377
93
141
59
297
49
385
72
229
88
238
30
254
80
105
94
347
80
180
53
119
55
288
48
142
67
241
96
293
45
72
57
318
36
314
82
319
94
196
81
60
60
209
79
319
42
306
79
184
81
167
51
193
56
380
44
239
34
389
88
144
49
122
49
97
100
354
76
337
33
327
94
330
78
181
70
157
57
349
66
262
43
117
35…
The article “Effects of Diets with Whole Plant-Origin Proteins Added with Different Ratiosof Taurine:Methionine on the Growth, Macrophage Activity and Antioxidant Capacity ofRainbow Trout (Oncorhynchus mykiss) Fingerlings” (O. Hernandez, L. Hernandez, et al.,Veterinary and Animal Science, 2017:4-9) reports that a sample of 210 juvenile rainbowtrout fed a diet fortified with equal amounts of the amino acids taurine and methionine for aperiod of 70 days had a mean weight gain of 313 percent with a standard deviation of 25, while 210 fish fed with a control diet had a mean weight gain of 233 percent with a standard deviation of 19. Units are percent. Find a 99% confidence interval for the difference in weight gain on the two diets.
Chapter 3 Solutions
Statistics for Business and Economics (13th Edition)
Ch. 3.1 - An experiment results in one of the following...Ch. 3.1 - The diagram below describes the sample space of a...Ch. 3.1 - The sample space for an experiment contains five...Ch. 3.1 - Compute each of the following: a. (94) b. (72) c....Ch. 3.1 - Compute the number of ways you can select n...Ch. 3.1 - Two fair dice are tossed, and the face on each die...Ch. 3.1 - Two marbles are drawn at random and without...Ch. 3.1 - Use the applet Simulating the Probability of...Ch. 3.1 - Use the applet Simulating the Probability of a...Ch. 3.1 - Cable TV subscriptions and "cord cutters." Refer...
Ch. 3.1 - Do social robots walk or roll? Refer to the...Ch. 3.1 - Colors of MMs candies. When they were first...Ch. 3.1 - Male nannies. In a survey conducted by the...Ch. 3.1 - Working on summer vacation. Is summer vacation a...Ch. 3.1 - Mobile access to social media. The Marketing...Ch. 3.1 - Performance-based logistics. Refer to the Journal...Ch. 3.1 - Who prepares your tax return? As part of a study...Ch. 3.1 - Consumer recycling behavior. Refer to the Journal...Ch. 3.1 - Museum management. Refer to the Museum Management...Ch. 3.1 - USDA chicken inspection. The U.S. Department of...Ch. 3.1 - Jamming attacks on wireless networks. Refer to the...Ch. 3.1 - Randomization in a study of TV commercials....Ch. 3.1 - Jai-alai bets. The Quinella bet at the paramutual...Ch. 3.1 - Investing in stocks. From a list of 15 preferred...Ch. 3.1 - Highest-rated car brands. Consumer Reports 2015...Ch. 3.1 - Volkswagen emissions scandal. Refer to the...Ch. 3.1 - Drug testing of firefighters. Hillsborough County...Ch. 3.1 - Odds of winning a race. Handicappers for greyhound...Ch. 3.1 - Lead bullets as forensic evidence. Chance (Summer...Ch. 3.1 - Making your vote count. Democratic and Republican...Ch. 3.4 - Suppose P (A) = A, P(B) = 7, and P (A B) = 3....Ch. 3.4 - A fair coin is tossed three times, and the events...Ch. 3.4 - A pair of fair dice is tossed. Define the...Ch. 3.4 - Consider the Venn diagram below, where P(E1) =...Ch. 3.4 - Consider the Venn diagram in the next column,...Ch. 3.4 - Prob. 3.35LMCh. 3.4 - Prob. 3.36LMCh. 3.4 - Use the applets Simulating the Probability of...Ch. 3.4 - Prob. 3.4AECh. 3.4 - Do social robots walk or roll? Refer to the...Ch. 3.4 - Firefighter glove sizing. Human Factors (December...Ch. 3.4 - Study of analysts' forecasts. The Journal of...Ch. 3.4 - Problems at major companies The Organization...Ch. 3.4 - Scanning errors at Walmart. The National Institute...Ch. 3.4 - Social networking Web sites in the United Kingdom....Ch. 3.4 - Paying monthly bills online. Do most people pay...Ch. 3.4 - Fuzzy logic in supply chain management. A branch...Ch. 3.4 - Study of why EMS workers leave the job. An...Ch. 3.4 - Stock market participation and IQ. The Journal of...Ch. 3.4 - Cell phone handoff behavior. A "handoff' is a term...Ch. 3.4 - Guilt in decision making. The effect of guilt...Ch. 3.4 - Likelihood of a tax return audit. At the beginning...Ch. 3.4 - Prob. 3.50ACACh. 3.4 - Encoding variability in software. At the 2012 Gulf...Ch. 3.6 - For two events, A and B, P (A) .4, P (B) .2, and...Ch. 3.6 - For two events, A and B, P (A) = .4, P (B) = .2,...Ch. 3.6 - An experiment results in one of three mutually...Ch. 3.6 - For two independent events, A and B, P (A) = .4...Ch. 3.6 - Two fair coins are tossed, and the following...Ch. 3.6 - Consider the experiment depicted by the Venn...Ch. 3.6 - Two fair dice are tossed, and the following events...Ch. 3.6 - A sample space contains six sample points and...Ch. 3.6 - Use the applet Simulating the Probability of...Ch. 3.6 - On-the-job arrogance and task performance. Human...Ch. 3.6 - World's largest public companies. Forbes (May 6,...Ch. 3.6 - Guilt in decision making. Refer to the Journal of...Ch. 3.6 - Blood diamonds. According to Global Research News...Ch. 3.6 - Do social robots walk or roll? Refer to the...Ch. 3.6 - Shopping with a smartphone. Each year, United...Ch. 3.6 - Identity theft victims. According to The National...Ch. 3.6 - Study of why EMS workers leave the job. Refer to...Ch. 3.6 - Working on summer vacation. Refer to the Harris...Ch. 3.6 - Stock market participation and IQ. Refer to The...Ch. 3.6 - Prob. 3.70ACICh. 3.6 - Ambulance response time. Geographical Analysis...Ch. 3.6 - Working mothers with children. The U S Census...Ch. 3.6 - Firefighters' use of gas detection devices. Two...Ch. 3.6 - Wine quality and soil. The Journal of Wine...Ch. 3.6 - Are you really being served red snapper? Red...Ch. 3.6 - Random shuffling of songs on Spotify. Spotify is a...Ch. 3.6 - Forensic evidence in a criminal court case. In our...Ch. 3.6 - Prob. 3.78ACACh. 3.6 - Prob. 3.79ACACh. 3.6 - Encryption systems with erroneous ciphertexts. In...Ch. 3.7 - Suppose the events B1 and B2 are mutually...Ch. 3.7 - Prob. 3.82LMCh. 3.7 - Prob. 3.83LMCh. 3.7 - Confidence of feedback information for improving...Ch. 3.7 - Fingerprint expertise. A study published in...Ch. 3.7 - Tests for Down syndrome. Currently, there are...Ch. 3.7 - Fish contaminated by a plants toxic discharge....Ch. 3.7 - Errors in estimating job costs. A construction...Ch. 3.7 - Mining for dolomite. Dolomite is a valuable...Ch. 3.7 - Nondestructive evaluation. Nondestructive...Ch. 3.7 - Drug testing in the workplace. In Canada, the...Ch. 3.7 - Intrusion detection systems. The Journal of...Ch. 3.7 - Forensic analysis of JFK assassination bullets....Ch. 3 - Which of the following pairs of events are...Ch. 3 - A sample space consists of four sample points,...Ch. 3 - For two events A and B, suppose P (A) = .7, P (B)...Ch. 3 - A and B are mutually exclusive events, with P (A)...Ch. 3 - Two events, A and B , are independent, with P (A) ...Ch. 3 - Prob. 3.99LMCh. 3 - Prob. 3.100LMCh. 3 - The Venn diagram below illustrates a sample space...Ch. 3 - Use the applet entitled Random Numbers to generate...Ch. 3 - Find the numerical value of a. 6! b. (109) c....Ch. 3 - Management system failures. Refer to the Process...Ch. 3 - Workers unscheduled absence survey. Each year CCH,...Ch. 3 - Ownership of small businesses. According to the...Ch. 3 - Condition of public school facilities. The...Ch. 3 - New car crash tests. Refer to the National Highway...Ch. 3 - Speeding linked to fatal car crashes. According to...Ch. 3 - Choosing portable grill displays. Consider a study...Ch. 3 - Inactive oil and gas structures. U.S. federal...Ch. 3 - Is a product green? A green product (e.g., a...Ch. 3 - Monitoring quality of power equipment. Mechanical...Ch. 3 - Appeals of federal civil trials. The Journal of...Ch. 3 - Characteristics of a new product. The long-run...Ch. 3 - Testing a watch manufacturers claim. A...Ch. 3 - Ranking razor blades. The corporations in the...Ch. 3 - Reliability of gas station air gauges. Tire and...Ch. 3 - Which events are independent? Use your intuitive...Ch. 3 - Home modifications for wheelchair users. The...Ch. 3 - World Cup soccer match draws. Every 4 years the...Ch. 3 - Chance of an Avon sale. The probability that an...Ch. 3 - Drug testing in athletes. When Olympic athletes...Ch. 3 - Profile of a sustainable farmer. Sustainable...Ch. 3 - Evaluating the performance of quality inspectors....Ch. 3 - Using game simulation to teach a course. In...Ch. 3 - Patient medical instruction sheets. Physicians and...Ch. 3 - Detecting traces of TNT. University of Florida...Ch. 3 - The three-dice gambling problem. According to...Ch. 3 - Scrap rate of machine parts. A press produces...Ch. 3 - Chance of winning at craps. A version of the dice...Ch. 3 - Chance of winning blackjack. Blackjack, a favorite...Ch. 3 - Software defects in NASA spacecraft instrument...Ch. 3 - Lets Make a Deal. Marilyn vos Savant, who is...Ch. 3 - Flawed Pentium computer chip. In October 1994, a...Ch. 3 - Exit polls are conducted in selected locations as...Ch. 3 - Define events A and B as follows: A: {Purchase...Ch. 3 - Now define events A and B in this manner: A:...
Knowledge Booster


Learn more about
Need a deep-dive on the concept behind this application? Look no further. Learn more about this topic, statistics and related others by exploring similar questions and additional content below.Similar questions
- 6. In the book Business Research Methods (5th ed.), Donald R. Cooper and C. William Emory discuss studying the relationship between on-the-job accidents and smoking. Cooper and Emory describe the study as follows: Suppose a manager implementing a smoke-free workplace policy is interested in whether smoking affects worker accidents. Since the company has complete reports of on-the-job accidents, she draws a sample of names of workers who were involved in accidents during the last year. A similar sample from among workers who had no reported accidents in the last year is drawn. She interviews members of both groups to determine if they are smokers or not. The sample results are given in the following table.arrow_forwardSuppose a researcher is interested inthe effectiveness in a new childhood exercise program implemented in a SRS of schools across a particular county. In order to test the hypothesis that the new program decreases BMI (Kg/m2), the researcher takes a SRS of children from schools where the program is employed and a SRS from schools that do not employ the program and compares the results. Assume the following table represents the SRSs of students and their BMIs. Student intervention group BMI (kg/m2) Student control group BMI (kg/m2) A 18.6 A 21.6 B 18.2 B 18.9 C 19.5 C 19.4 D 18.9 D 22.6 E 24.1 F 23.6 A) Assuming that all the necessary conditions are met (normality, independence, etc.) carry out the appropriate statistical test to determine if the new exercise program is effective. Use an alpha level of 0.05. Do not assume equal variances.B) Construct a 95% confidence interval about your estimate for the average difference in BMI between the groups.arrow_forwardIn the book Business Research Methods (5th ed.), Donald R. Cooper and C. William Emory discuss studying the relationship between on-the-job accidents and smoking. Cooper and Emory describe the study as follows: Suppose a manager implementing a smoke-free workplace policy is interested in whether smoking affects worker accidents. Since the company has complete reports of on-the-job accidents, she draws a sample of names of workers who were involved in accidents during the last year. A similar sample from among workers who had no reported accidents in the last year is drawn. She interviews members of both groups to determine if they are smokers or not. The sample results are given in the following table. On-the-Job Accident Smoker Yes No Row Total Heavy 12 5 17 Moderate 9 10 19 Nonsmoker 13 17 30 Column total 34 32 66 Expected counts are below observed counts Accident No Accident Total Heavy 12 5 17 8.76 8.24…arrow_forward
- An automotive engineer is investigating two different types of metering devices for an electronic fuel injection system to determine whether they differ in their fuel mileage performance. The system is installed on 10 different cars, and a test is run with each metering device on each car. The data is provided below: Metering Device Car 1 2 1 17.6 16.8 2 19.4 20.0 3 18.2 17.6 4 17.1 16.4 5 15.3 16.0 6 15.9 15.9 7 16.3 16.5 8 18.0 18.4 9 17.3 16.4 10 19.1 20.1 Is there a significant difference between the means of the two metering devices? Use . Interpret the result in the context of the problem. An article in the journal Hazardous Waste and Hazardous Materials (Vol. 6, 1989) reported the results of an analysis of the weight of calcium in standard cement and cement doped with lead. Reduced levels of calcium would indicate that the hydration mechanism in the cement is blocked…arrow_forwardA paper investigated the driving behavior of teenagers by observing their vehicles as they left a high school parking lot and then again at a site approximately 1 2 mile from the school. Assume that it is reasonable to regard the teen drivers in this study as representative of the population of teen drivers. MaleDriver FemaleDriver 1.3 -0.3 1.3 0.6 0.9 1.1 2.1 0.7 0.7 1.1 1.3 1.2 3 0.1 1.3 0.9 0.6 0.5 2.1 0.5 (a) Use a .01 level of significance for any hypothesis tests. Data consistent with summary quantities appearing in the paper are given in the table. The measurements represent the difference between the observed vehicle speed and the posted speed limit (in miles per hour) for a sample of male teenage drivers and a sample of female teenage drivers. (Use ?males − ?females. Round your test statistic to two decimal places. Round your degrees of freedom down to the nearest whole number. Round your p-value to three decimal places.) t = df =…arrow_forwardExercises 5–8 refer to the study of an association between which ear is used for cell phone calls and whether the subject is left-handed or right-handed. The study is reported in “Hemispheric Dominance and Cell Phone Use,” by Seidman et al., JAMA Otolaryngology—Head & Neck Surgery, Vol. 139, No. 5. The study began with a survey e-mailed to 5000 people belonging to an otology online group, and 717 surveys were returned. (Otology relates to the ear and hearing.) Sampling Method What type of sampling best describes the way in which the 717 subjects were chosen: simple random sample, systematic sample, convenience sample, stratified sample, cluster sample? Does the method of sampling appear to adversely affect the quality of the results?arrow_forward
- Exercises 5–8 refer to the study of an association between which ear is used for cell phone calls and whether the subject is left-handed or right-handed. The study is reported in “Hemispheric Dominance and Cell Phone Use,” by Seidman et al., JAMA Otolaryngology—Head & Neck Surgery, Vol. 139, No. 5. The study began with a survey e-mailed to 5000 people belonging to an otology online group, and 717 surveys were returned. (Otology relates to the ear and hearing.)arrow_forwardA paper investigated the driving behavior of teenagers by observing their vehicles as they left a high school parking lot and then again at a site approximately 1 2 mile from the school. Assume that it is reasonable to regard the teen drivers in this study as representative of the population of teen drivers. MaleDriver FemaleDriver 1.4 -0.2 1.2 0.5 0.9 1.1 2.1 0.7 0.7 1.1 1.3 1.2 3 0.1 1.3 0.9 0.6 0.5 2.1 0.5 (a) Use a .01 level of significance for any hypothesis tests. Data consistent with summary quantities appearing in the paper are given in the table. The measurements represent the difference between the observed vehicle speed and the posted speed limit (in miles per hour) for a sample of male teenage drivers and a sample of female teenage drivers. (Use ?males − ?females. Round your test statistic to two decimal places. Round your degrees of freedom down to the nearest whole number. Round your p-value to three decimal places.) t = df =…arrow_forwardA research article on the effect of multitasking on grade performance describes an experiment in which 62 undergraduate business students were randomly assigned to one of two experimental groups. Students in one group were asked to listen to a lecture but were told that they were permitted to use cell phones to send text messages during the lecture. Students in the second group listened to the same lecture but were not permitted to send text messages. Afterwards, students in both groups took a quiz on material covered in the lecture. Data from this experiment are summarized in the accompanying table.arrow_forward
- 5h. David's Landscaping has collected data on home values (in thousands of $) and expenditures (in thousands of $) on landscaping with the hope of developing a predictive model to help marketing to potential new clients. Data for 14 households may be found in the file Landscape. HomeValue($1,000) LandscapingExpenditures($1,000) 242 8.1 321 10.8 198 12.2 340 16.2 300 15.6 400 18.9 800 23.5 200 9.5 521 17.5 547 22.0 437 12.1 464 13.5 635 17.9 356 13.9 (c) Use the least squares method to develop the estimated regression equation. (Let x = home value (in thousands of $), and let y = landscaping expenditures (in thousands of $). Round your numerical values to five decimal places.) ŷ = (d) For every additional $1,000 in home value, estimate how much additional will be spent (in $) on landscaping. (Round your answer to the nearest cent.) $ (e) Use the equation estimated in part (c) to predict the landscaping expenditures (in $) for a…arrow_forwardThere is some evidence that, in the years 1981-85, a simple name change resulted in a short-term increase in the price of certain business firms' stocks (relative to the prices of similar stocks). (See D. Horsky and P. Swyngedouw, "Does it pay to change your company's name? A stock market perspective," Marketing Science v.6, pp. 320-35,1987.) Suppose that, to test the profitability of name changes in the more recent market (the past five years), we analyze the stock prices of a large sample of corporations shortly after they changed names, and we find that the mean relative increase in stock price was about 0.87 %, with a standard deviation of 16 %. Suppose that this mean and standard deviation apply to the population of all companies that changed names during the past five years. Complete the following statements about the distribution of relative increases in stock price for all companies that changed names during the past five years. (a) According to Chebyshev's theorem, at least…arrow_forwardThe following data represents results from an experiment comparing 3 treatment conditions for the cure of boredom. Treatment 1 is doing schoolwork, Treatment 2 is watching tv, and Treatment 3 is spending time with friends. The following scores represent treatment effectiveness scores where higher values indicate that the treatment of boredom was effective and lower values indicate that the treatment of boredom was ineffective. Treatment 1 Treatment 2 Treatment 3 0 1 6 N= 12 1 4 5 GM= 3.00 0 1 8 3 2 5…arrow_forward
arrow_back_ios
SEE MORE QUESTIONS
arrow_forward_ios
Recommended textbooks for you
 MATLAB: An Introduction with ApplicationsStatisticsISBN:9781119256830Author:Amos GilatPublisher:John Wiley & Sons Inc
 Probability and Statistics for Engineering and th...StatisticsISBN:9781305251809Author:Jay L. DevorePublisher:Cengage Learning
 Statistics for The Behavioral Sciences (MindTap C...StatisticsISBN:9781305504912Author:Frederick J Gravetter, Larry B. WallnauPublisher:Cengage Learning
 Elementary Statistics: Picturing the World (7th E...StatisticsISBN:9780134683416Author:Ron Larson, Betsy FarberPublisher:PEARSON
 The Basic Practice of StatisticsStatisticsISBN:9781319042578Author:David S. Moore, William I. Notz, Michael A. FlignerPublisher:W. H. Freeman
 Introduction to the Practice of StatisticsStatisticsISBN:9781319013387Author:David S. Moore, George P. McCabe, Bruce A. CraigPublisher:W. H. Freeman
MATLAB: An Introduction with Applications
Statistics
ISBN:9781119256830
Author:Amos Gilat
Publisher:John Wiley & Sons Inc
Probability and Statistics for Engineering and th...
Statistics
ISBN:9781305251809
Author:Jay L. Devore
Publisher:Cengage Learning
Statistics for The Behavioral Sciences (MindTap C...
Statistics
ISBN:9781305504912
Author:Frederick J Gravetter, Larry B. Wallnau
Publisher:Cengage Learning
Elementary Statistics: Picturing the World (7th E...
Statistics
ISBN:9780134683416
Author:Ron Larson, Betsy Farber
Publisher:PEARSON
The Basic Practice of Statistics
Statistics
ISBN:9781319042578
Author:David S. Moore, William I. Notz, Michael A. Fligner
Publisher:W. H. Freeman
Introduction to the Practice of Statistics
Statistics
ISBN:9781319013387
Author:David S. Moore, George P. McCabe, Bruce A. Craig
Publisher:W. H. Freeman
Hypothesis Testing using Confidence Interval Approach; Author: BUM2413 Applied Statistics UMP;https://www.youtube.com/watch?v=Hq1l3e9pLyY;License: Standard YouTube License, CC-BY
Hypothesis Testing - Difference of Two Means - Student's -Distribution & Normal Distribution; Author: The Organic Chemistry Tutor;https://www.youtube.com/watch?v=UcZwyzwWU7o;License: Standard Youtube License