
Videos
a.
To create a graph
a.
Explanation of Solution
Given information:
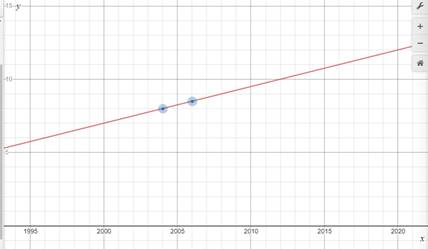
In 2004, 8 million American participated
In 2006, 8.5 million American participated.
Graph:
Interpretation:
The x -axis is year and y -axis is number of people in millions.
b.
To find the growth of sport.
b.
Answer to Problem 26PPS
The growth is
Explanation of Solution
Given information:
In 2004, 8 million American participated
In 2006, 8.5 million American participated.
Formulaused:
Where,
Calculation:
Slope of the line is the growth of sports. So, to find slope,
Coordinates are:
Substituting value,
Slope of line is,
Solving,
Slope is
Hence, growth of sports is
a.
To find the total participants in 2013
a.
Answer to Problem 26PPS
Total participants are 10.2 million approximately.
Explanation of Solution
Given information:
In 2004, 8 million American participated
In 2006, 8.5 million American participated.
Calculation:
Observing the graph, the number of participants can be found by looking at value of y -axis on 2013.
So, number of participants are 10.2 million approximately.
Chapter 3 Solutions
Geometry, Student Edition
Additional Math Textbook Solutions
Calculus Volume 1
Calculus and Its Applications (11th Edition)
Thinking Mathematically (6th Edition)
Calculus: Early Transcendentals (2nd Edition)
Mathematics All Around (6th Edition)
Single Variable Calculus: Early Transcendentals (2nd Edition) - Standalone book


 Elementary Geometry For College Students, 7eGeometryISBN:9781337614085Author:Alexander, Daniel C.; Koeberlein, Geralyn M.Publisher:Cengage,
 Elementary Geometry for College StudentsGeometryISBN:9781285195698Author:Daniel C. Alexander, Geralyn M. KoeberleinPublisher:Cengage Learning