Concept explainers
Videos
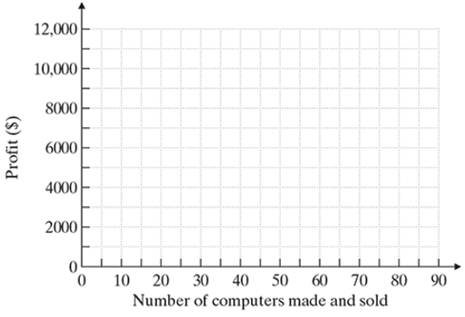
Computer Manufacturing The following table shows the relationship between the number of computers manufactured and sold by a company each day and the company’s profit for that day.
Number of Computers Made and Sold |
20 |
30 |
40 |
50 |
60 |
70 |
80 |
Profit for the Company ($) |
0 |
5000 |
8000 |
9000 |
8000 |
5000 |
0 |
a. Plot the points and connect them to graph the underlying function.
b. How many computers should be made and sold each day to achieve the maximum profit?
c. If the company wants to earn a profit of S8000 or more each day, how many computers should it manufacture and sell each day?
d. What will the profit picture be if the company manufactures and sells eighty-two computers per day?
e. Estimate the profit if the company manufactures forty-five computers per day.
Want to see the full answer?
Check out a sample textbook solution
Chapter 3 Solutions
Intermediate Algebra Books a la Carte Edition PLUS MyLab Math (8th Edition)


- High School Graduates The following table shows the number, in millions, graduating from high school in the United States in the given year. Year Number graduating in millions 1985 2.83 1987 2.65 1989 2.47 1991 2.29 a. By calculating difference, show that these data can be modeled using a linear function. b. What is the slope for the linear function modeling high school graduations? Explain in practical terms the meaning of the slope. c. Find a formula for a linear function that models these data. d. Express, using functional notation, the number graduating from high school in 1994, and then use your formula from part c to calculate that value.arrow_forwardDemand for Soft Drinks A convenience stores manager notices that sales of soft drinks are higher on hotter days, so he assembles the data in the table. a Make a scatter plot of the data. b Find and graph a linear function that models the data. c Use the model to predict soft drink sales if the temperature is 95. High temperature Number of cans sold 55 340 58 335 64 410 68 460 70 450 75 610 80 735 84 780arrow_forwardHOW DO YOU SEE IT? The graphs labeled L1,L2,L3, and L4 represent four different pricing discounts, where p is the original price (in dollars) and S is the sale price (in dollars). Match each function with its graph. Describe the situations in parts c and d. a fp:A50 discount is applied. b gp:A$5 discount is applied. c gfp d fgparrow_forward
 Algebra and Trigonometry (MindTap Course List)AlgebraISBN:9781305071742Author:James Stewart, Lothar Redlin, Saleem WatsonPublisher:Cengage Learning
 Glencoe Algebra 1, Student Edition, 9780079039897...AlgebraISBN:9780079039897Author:CarterPublisher:McGraw Hill
 Trigonometry (MindTap Course List)TrigonometryISBN:9781337278461Author:Ron LarsonPublisher:Cengage Learning
 Functions and Change: A Modeling Approach to Coll...AlgebraISBN:9781337111348Author:Bruce Crauder, Benny Evans, Alan NoellPublisher:Cengage Learning
 Big Ideas Math A Bridge To Success Algebra 1: Stu...AlgebraISBN:9781680331141Author:HOUGHTON MIFFLIN HARCOURTPublisher:Houghton Mifflin Harcourt