
Concept explainers
Videos
(a)
To find: The equation of the best line fit with the help of graphing calculator.
(a)
Answer to Problem 11CT
The equation for the best fit line is
Explanation of Solution
Given:
The given table is shown in Table 1
Table 1
| Advertising (dollars )x | Yearly attendance, y |
| 500 | 400 |
| 1000 | 550 |
| 1500 | 550 |
| 2000 | 800 |
| 2500 | 650 |
| 3000 | 800 |
| 3500 | 1050 |
| 4000 | 1100 |
Calculation:
Input the values shown in Table 1 in the calculator and the result obtained is shown in Figure 1
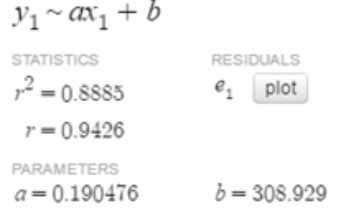
Figure 1
Thus, the equation for the best fit line is
(b)
To find: The interpretation for the
(b)
Answer to Problem 11CT
The value of
Explanation of Solution
Given:
The given table is shown in Table 1
Table 1
| Advertising (dollars )x | Yearly attendance, y |
| 500 | 400 |
| 1000 | 550 |
| 1500 | 550 |
| 2000 | 800 |
| 2500 | 650 |
| 3000 | 800 |
| 3500 | 1050 |
| 4000 | 1100 |
Calculation:
From part (a) the correlation coefficient obtained is 0.9426. The value is close to 1 that means that the linear model is the good fit.
(c)
To find: The expectation for the scatter plot of the residuals.
(c)
Answer to Problem 11CT
The scatter plot is supposed to be evenly dispersed about the horizontal axis.
Explanation of Solution
Given:
The given table is shown in Table 1
Table 1
| Advertising (dollars )x | Yearly attendance, y |
| 500 | 400 |
| 1000 | 550 |
| 1500 | 550 |
| 2000 | 800 |
| 2500 | 650 |
| 3000 | 800 |
| 3500 | 1050 |
| 4000 | 1100 |
Calculation:
From the value of the correlation the model is the good fit and being a good fit the expected scatter plot must be evenly dispersed about the horizontal axis.
(d)
To find: Whether there is any causal relationship in the data.
(d)
Answer to Problem 11CT
The number of people attending is proportional to the number of people viewing the advertisement.
Explanation of Solution
Given:
The given table is shown in Table 1
Table 1
| Advertising (dollars )x | Yearly attendance, y |
| 500 | 400 |
| 1000 | 550 |
| 1500 | 550 |
| 2000 | 800 |
| 2500 | 650 |
| 3000 | 800 |
| 3500 | 1050 |
| 4000 | 1100 |
Calculation:
From the given data shown in Table 1 the casual relationship that arise is that, more the number of people know about the advertisement the more they attend the festival.
Thus, the number of people attending is proportional to the number of people viewing the advertisement.
(e)
To find: The prediction for the amount that must be spent on the advertising to get 2000 people to attend the festival.
(e)
Answer to Problem 11CT
The amount that must be spent is
Explanation of Solution
Given:
The given table is shown in Table 1
Table 1
| Advertising (dollars )x | Yearly attendance, y |
| 500 | 400 |
| 1000 | 550 |
| 1500 | 550 |
| 2000 | 800 |
| 2500 | 650 |
| 3000 | 800 |
| 3500 | 1050 |
| 4000 | 1100 |
Calculation:
From the given data, consider the equation for the best fit is
Then,
Thus, the amount that must be spent is
Chapter 4 Solutions
BIG IDEAS MATH Algebra 1: Common Core Student Edition 2015


 Algebra and Trigonometry (6th Edition)AlgebraISBN:9780134463216Author:Robert F. BlitzerPublisher:PEARSON
 Contemporary Abstract AlgebraAlgebraISBN:9781305657960Author:Joseph GallianPublisher:Cengage Learning
 Linear Algebra: A Modern IntroductionAlgebraISBN:9781285463247Author:David PoolePublisher:Cengage Learning
 Algebra And Trigonometry (11th Edition)AlgebraISBN:9780135163078Author:Michael SullivanPublisher:PEARSON
 Introduction to Linear Algebra, Fifth EditionAlgebraISBN:9780980232776Author:Gilbert StrangPublisher:Wellesley-Cambridge Press
 College Algebra (Collegiate Math)AlgebraISBN:9780077836344Author:Julie Miller, Donna GerkenPublisher:McGraw-Hill Education