
Concept explainers
Videos
a.
To calculate: The equation of line of best fit using graphing calculator, then to further identify and interpret the
a.
Answer to Problem 31E
Equation of
Explanation of Solution
Given Information: Data values of year,
Calculation:
Entering the data and using the linear regression feature in the graphing calculator,
As
Thus, the equation of
Interpretation:
Graphing calculator results display that
As
Thus,
b.
The existence of a causal relationship.
b.
Answer to Problem 31E
Yes, there is causal relationship.
Explanation of Solution
Given information: Data values of year,
Yes, this is a casual relationship. As the years passed by the use of mobile phones surged and it resulted in more and more messages being sent.
c.
To calculate: The residuals and then to make scatter plot of the residuals and interpret results.
c.
Answer to Problem 31E
The equation
Explanation of Solution
Given Information: Data values of year,
Calculation:
Calculating the
Graph:
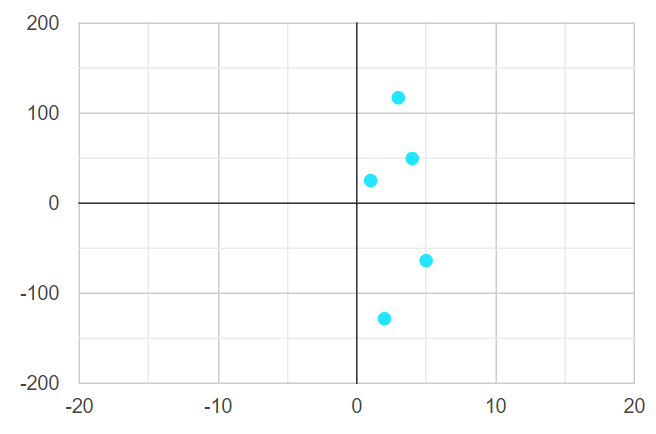
The points are evenly distributed about the horizontal axis,
Thus, the equation
d.
To compare: Methods used in part
d.
Answer to Problem 31E
Method implemented in part
Explanation of Solution
Given Information: Part
Method used in part
Chapter 4 Solutions
BIG IDEAS MATH Algebra 1: Common Core Student Edition 2015


 Algebra and Trigonometry (6th Edition)AlgebraISBN:9780134463216Author:Robert F. BlitzerPublisher:PEARSON
 Contemporary Abstract AlgebraAlgebraISBN:9781305657960Author:Joseph GallianPublisher:Cengage Learning
 Linear Algebra: A Modern IntroductionAlgebraISBN:9781285463247Author:David PoolePublisher:Cengage Learning
 Algebra And Trigonometry (11th Edition)AlgebraISBN:9780135163078Author:Michael SullivanPublisher:PEARSON
 Introduction to Linear Algebra, Fifth EditionAlgebraISBN:9780980232776Author:Gilbert StrangPublisher:Wellesley-Cambridge Press
 College Algebra (Collegiate Math)AlgebraISBN:9780077836344Author:Julie Miller, Donna GerkenPublisher:McGraw-Hill Education