Concept explainers
Videos
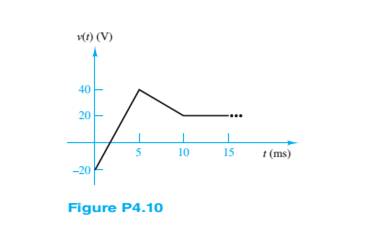
The voltage waveform shown in Figure P4.10 is piece wise linear and continuous. Assume the voltage is across a
4.10 The voltage waveform shown in Figure P4.10 is piecewise linear and continuous. Assume the voltage is across a 20-mH inductor. Determine the current
Want to see the full answer?
Check out a sample textbook solution
Chapter 4 Solutions
Principles and Applications of Electrical Engineering


- If the plots shown in Figure P4.19 are the voltageacross and the current through an ideal inductor,determine the inductance.arrow_forwardConsider the circuit shown in Figure P4.40. A voltmeter (VM) is connected across the inductance. The switch has been closed for a long time. When the switch is opened, an arc appears across the switch contacts. Explain why. Assuming an ideal switch and inductor, what voltage appears across the inductor when the switch is opened? What could happen to the voltmeter when the switch opens?arrow_forwardThe voltage waveform shown in Figure P4.24appears across a 100-mH inductor and a 500-μFcapacitor. Plot the capacitor and inductor currents,iC(t) and iL(t), assuming iL(0) = 0A.arrow_forward
- We know that the capacitor shown in Figure P4.11 is charged to a voltage of 10 V priorto t=0.a. Find expressions for the voltage across the capacitor vC(t) and the voltage across theresistor vR(t) for all time.b. Find an expression for the power delivered to the resistor.c. Integrate the power from t=0 to t=∞ to find the energy delivered.d. Show that the energy delivered to the resistor is equal to the energy stored in thecapacitor prior to t=0.arrow_forwardThe voltage across and the current through acapacitor are shown in Figure P4.20. Determine thevalue of the capacitance.arrow_forwardIf the waveform shown in Figure P4.15 is thevoltage across a capacitor plotted as a function of timewithvPK = 20V, T = 40 μs, C = 680nFdetermine and plot the waveform for the currentthrough the capacitor as a function of time.arrow_forward
- The voltage across an inductor plotted as a functionof time is shown in Figure P4.14. If L = 0.75 mH,determine the current through the inductor att = 15 μs.arrow_forwardDetermine expressions for and sketch v R ( t ) to scale versus time for the circuit of Figure P4.43. The circuit is operating in steady state with the switch closed prior to t=0. Consider the time interval −1≤t≤5 ms.arrow_forwardIn Figure P4.64, let R=500 Ω. Using the inductor current, derive the Characteristic Equation.arrow_forward
- The initial voltage across the capacitor shown in Figure P4.3 is v C ( 0+ )=0. Find an expression for the voltage across the capacitor as a function of time, and sketch to scale versus timearrow_forwardAt t=0 a charged 10{μF capacitance is connected to a voltmeter, as shown in Figure P4.5. The meter can be modeled as a resistance. At t=0 the meter reads 50 V. At t=30s, the reading is 25 V. Find the resistance of the voltmeter.arrow_forwardThe current waveform shown in Figure P4.23 flowsthrough a 2-H inductor. Plot the inductor voltage vL(t).arrow_forward
 Introductory Circuit Analysis (13th Edition)Electrical EngineeringISBN:9780133923605Author:Robert L. BoylestadPublisher:PEARSON
 Delmar's Standard Textbook Of ElectricityElectrical EngineeringISBN:9781337900348Author:Stephen L. HermanPublisher:Cengage Learning
 Programmable Logic ControllersElectrical EngineeringISBN:9780073373843Author:Frank D. PetruzellaPublisher:McGraw-Hill Education
 Fundamentals of Electric CircuitsElectrical EngineeringISBN:9780078028229Author:Charles K Alexander, Matthew SadikuPublisher:McGraw-Hill Education
 Electric Circuits. (11th Edition)Electrical EngineeringISBN:9780134746968Author:James W. Nilsson, Susan RiedelPublisher:PEARSON
 Engineering ElectromagneticsElectrical EngineeringISBN:9780078028151Author:Hayt, William H. (william Hart), Jr, BUCK, John A.Publisher:Mcgraw-hill Education,