UNDERSTANDING BASIC STAT LL BUND >A< F
7th Edition
ISBN: 9781337372763
Author: BRASE
Publisher: Cengage Learning
bartleby

Videos

Textbook Question
Book Icon
Chapter 4.2, Problem 22P

Expand Your knowledge: Logarithmic Transformations. Exponential Growth Model There are several extensions of linear regression that apply to exponential growth and power law models. Problems 22-25 will outline some of these extensions. First of all. recall that a variable grows linearly over time if it adds a fixed increment during each equal period. Exponential growth occurs when a variable is multiplied by a fixed number during each period. This means that exponential growth increases by a fixed multiple or percentage of the previous amount. College algebra can be used to show that if a variable grows exponentially, then its logarithm grows linearly. The exponential growth model is y = α β x . where α  and  β are fixed constants to be estimated from data.

How do we know when we are dealing with exponential growth, and how can we estimate α  and  β ? Please read on. Populations of living things such as bacteria locusts, fish, panda bears, and so on lend to grow (or decline) exponentially. However, these populations can be restricted by outside limitations such as food, space, pollution, disease, hunting, and so on. Suppose we have data pairs (x, y) for which there is reason to believe the scatter plot is not linear but rather exponential, as described earlier. This means the increase in y values begins rather slowly but then seems to explode. Note: For exponential growth models, we assume all y > 0.

x 1 2 3 4 5
y 3 12 22 51 145

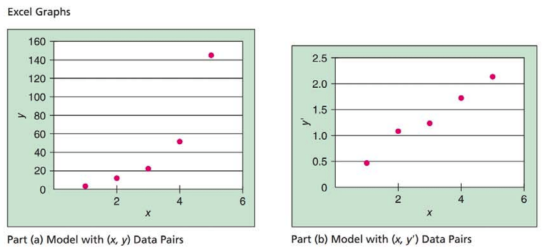
Consider the following data, where x = time in hours and y = number of bacteria in a laboratory culture at the end of x hours.

(a) Look at the Excel graph of the scatter diagram of the (x, y) data pairs. Do you think a straight line will be a good fit to these data? Do the y values seem almost to explode as time goes on?

(b) Now consider a transformation y '   =  log  y . We are using common logarithms of base 10 (however, natural logarithms of base e would work just as well).

x 1 2 3 4 5
y'=- log y 0.477 1.079 1.342 1.748 2.161

Look at the Excel graph of the scatter diagram of the (x. y') data pairs and compare this diagram with the diagram in part (a). Which graph appears to better fit a straight line?

Chapter 4.2, Problem 22P, Expand Your knowledge: Logarithmic Transformations. Exponential Growth Model There are several

(c) Use a calculator with regression keys to verify the linear regression equation for the (x, y) data pairs, y = 50.3   +   32.3 x , with sample correlation coefficient r = 0.882.

(d) Use a calculator with regression keys to verify the linear regression equation for the (x, y') data pairs, y '   =   0.150   + 0.404 x , with sample correlation coefficient r = 0.994. The sample correlation coefficient r = 0.882 for the (x, y) pairs is not bad. But the sample correlation coefficient r = 0.994 for the (x, y') pairs is a lot better!

(e) The exponential growth model is y   = α β x . Let us use the results of part (d) to estimate α  and  β for this strain of laboratory bacteria. The equation y ' = a + b x is the same as log y = a   +   b x . If we raise both sides of this equation to the power 10 and use some college algebra, we gel y   =   10 a (   10 b ) x . Thus, α =   10 a  and  β   =   10 b . Use these results to approximate α  and  β and write the exponential growth equation for our strain of bacteria.

Note: The TI-84Plus/TI-83Plu.s/TI-nspire calculators fully support the exponential growth model. Place the original x data in list LI and the corresponding y data in list L2. Then press STAT, followed by CALC, and scroll down to option 0: ExpReg. The output gives values for α , β . and the sample correlation coefficient r.

Blurred answer

Chapter 4 Solutions

UNDERSTANDING BASIC STAT LL BUND >A< F

Ch. 4.1 - Interpretation Trevor conducted a study and found...Ch. 4.1 - Interpretation Do people who spend more time on...Ch. 4.1 - Veterinary Science: Shetland Ponies How much...Ch. 4.1 - Health Insurance:Administrative Cost The following...Ch. 4.1 - Meteorology: Cyclones Can a low barometer reading...Ch. 4.1 - Geology: Earthquakes Is the magnitude of an...Ch. 4.1 - Baseball: Batting Averages and Home Runs In...Ch. 4.1 - University Crime: FBI Report Do larger...Ch. 4.1 - Prob. 19PCh. 4.1 - Prob. 20PCh. 4.1 - Expand Your Knowledge: Using a Table to Test The...Ch. 4.1 - Expand Your Knowledge: Sample Size and...Ch. 4.1 - Prob. 23PCh. 4.2 - Statistical Literacy In the least-squares line...Ch. 4.2 - Statistical Literacy In the least squares line...Ch. 4.2 - Critical Thinking When we use a least-squares line...Ch. 4.2 - Critical Thinking If two variables have a negative...Ch. 4.2 - Critical Thinking: Interpreting Computer Printouts...Ch. 4.2 - Critical Thinking: Interpreting Computer Printouts...Ch. 4.2 - Economics: Entry-Level Jobs An economist is...Ch. 4.2 - Ranching: Cattle You are the foreman of the Bar-S...Ch. 4.2 - Weight of Car: Miles per Gallon Do heavier cars...Ch. 4.2 - Basketball: Fouls Data for this problem are based...Ch. 4.2 - Auto Accidents: Age Data for this problem are...Ch. 4.2 - Auto Accidents: Age Let x be the age of a licensed...Ch. 4.2 - Incoine: Medicai Care Let x be per capita income...Ch. 4.2 - Violent Crimes: Prisons Does prison really deter...Ch. 4.2 - Education: Violent Crime The following data are...Ch. 4.2 - Research: Patents The following data are based on...Ch. 4.2 - Archaeology: Artifacts Data for this problem are...Ch. 4.2 - Cricket Chirps: Temperature Anyone who has been...Ch. 4.2 - Expand Your Knowledge: Residual Plot The...Ch. 4.2 - Residual Plot: Miles per Gallon Consider the data...Ch. 4.2 - Expand Your knowledge: Logarithmic...Ch. 4.2 - Expand Your Knowledge: Logarithmic...Ch. 4.2 - Prob. 24PCh. 4.2 - Expand Your Knowledge: Logarithmic...Ch. 4 - Statistical Literacy Suppose the scatter diagram...Ch. 4 - Critical Thinking Suppose you and a friend each...Ch. 4 - Statistical Literacy When using the least-squares...Ch. 4 - StatisticalLiteracy Suppose that for x = 3. the...Ch. 4 - In Problems 9-14, (a) Draw a scatter diagram for...Ch. 4 - In Problems 9-14, (a) Draw a scatter diagram for...Ch. 4 - In Problems 9-14, (a) Draw a scatter diagram for...Ch. 4 - In Problems 9-14, (a) Draw a scatter diagram for...Ch. 4 - In Problems 9-14, (a) Draw a scatter diagram for...Ch. 4 - In Problems 9-14, (a) Draw a scatter diagram for...Ch. 4 - Prob. 1UTACh. 4 - Prob. 2UTACh. 4 - Prob. 3UTACh. 4 - Prob. 4UTACh. 4 - The data in this section are taken from this...Ch. 4 - The data in this section are taken from this...
Knowledge Booster
Background pattern image
Statistics
Learn more about
Need a deep-dive on the concept behind this application? Look no further. Learn more about this topic, statistics and related others by exploring similar questions and additional content below.
Recommended textbooks for you
Text book image
Algebra for College Students
Algebra
ISBN:9781285195780
Author:Jerome E. Kaufmann, Karen L. Schwitters
Publisher:Cengage Learning
Text book image
College Algebra (MindTap Course List)
Algebra
ISBN:9781305652231
Author:R. David Gustafson, Jeff Hughes
Publisher:Cengage Learning
Text book image
Algebra & Trigonometry with Analytic Geometry
Algebra
ISBN:9781133382119
Author:Swokowski
Publisher:Cengage
Implicit Differentiation with Transcendental Functions; Author: Mathispower4u;https://www.youtube.com/watch?v=16WoO59R88w;License: Standard YouTube License, CC-BY
How to determine the difference between an algebraic and transcendental expression; Author: Study Force;https://www.youtube.com/watch?v=xRht10w7ZOE;License: Standard YouTube License, CC-BY