Fundamentals Of Cost Accounting (6th Edition)
6th Edition
ISBN: 9781259969478
Author: WILLIAM LANEN, Shannon Anderson, Michael Maher
Publisher: McGraw Hill Education
expand_more
expand_more
format_list_bulleted
Videos
Textbook Question
Chapter 5, Problem 64P
Interpretation of Regression Results
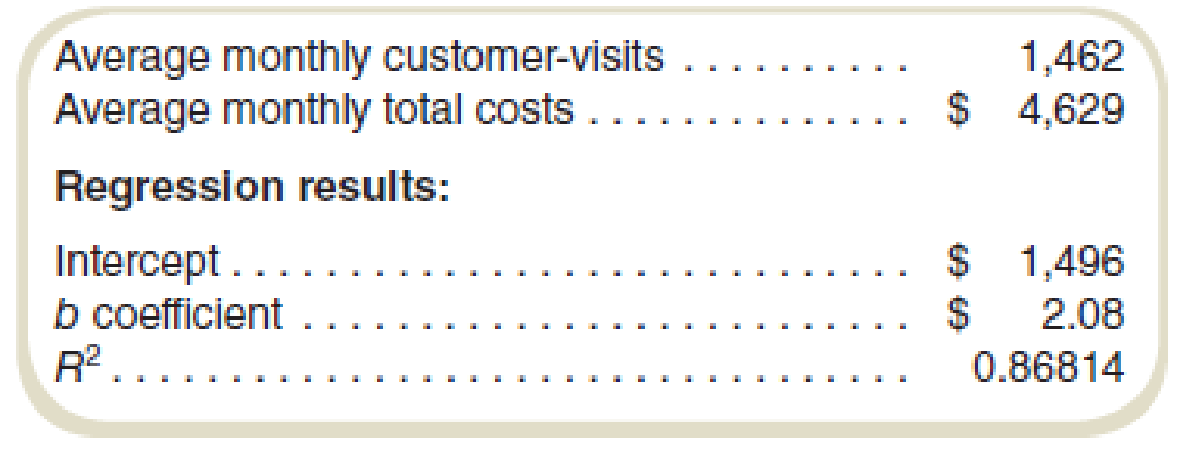
Brews 4 U is a local chain of coffee shops. Managers are interested in the costs of the stores and believe that the costs can be explained in large part by the number of customers patronizing the stores. Monthly data regarding customer visits and costs for the preceding year for one of the stores have been entered into the regression analysis.
Required
- a. In a regression equation expressed as y = a + bx, how is the letter b best described?
- b. How is the letter y in the regression equation best described?
- c. How is the letter x in the regression equation best described?
- d. Based on the data derived from the regression analysis, what are the estimated costs for 1,600 customer-visits in a month?
- e. What is the percent of the total variance that can be explained by the regression equation?
Expert Solution & Answer
Want to see the full answer?
Check out a sample textbook solution
Students have asked these similar questions
High-low method; regression analysis. (CIMA, adapted) Catherine McCarthy, sales manager of Baxter Arenas, is checking to see if there is any relationship between promotional costs and ticket revenues at the sports stadium. She obtains the following data for the past 9 months:
Regression analysis. The owner of a small hardware store has noted a sales pattern for window locks Problem 6that seems to parallel the number of break-ins reported each week in the newspaper. The data are:Sales: 46 18 20 22 27 34 14 37 30Break-ins: 9 3 3 5 4 7 2 6 4a. Plot the data to determine which type of equation, linear or nonlinear, is appropriate.b. Obtain a regression equation for the data.c. Estimate average sales when the number of break-ins is five.
Using Multiple Regression Results to Construct and Apply a Cost Formula
The controller for Dohini Manufacturing Company felt that the number of purchase orders alone did not explain the monthly purchasing cost. He knew that nonstandard orders (for example, one requiring an overseas supplier) took more time and effort. He collected data on the number of nonstandard orders for the past 12 months and added that information to the data on purchasing cost and total number of purchase orders.
Month
Purchasing Cost
Number of Purchase Orders
Number of Nonstandard Orders
January
$18,860
370
53
February
18,065
330
35
March
19,250
370
61
April
18,050
410
14
May
19,345
400
73
June
19,500
450
55
July
19,670
460
30
August
20,940…
Chapter 5 Solutions
Fundamentals Of Cost Accounting (6th Edition)
Ch. 5 - What are the common methods of cost estimation?Ch. 5 - Prob. 2RQCh. 5 - Under what conditions is the engineering estimates...Ch. 5 - If one wishes simply to prepare a cost estimate...Ch. 5 - When using cost estimation methods based on past...Ch. 5 - Prob. 6RQCh. 5 - What is the difference between R2 and adjusted R2?Ch. 5 - Why are accurate cost estimates important?Ch. 5 - What are three practical implementation problems...Ch. 5 - Why is it important to incorporate learning into...
Ch. 5 - What are some complications that can arise when...Ch. 5 - The following costs are labeled fixed or variable...Ch. 5 - Prob. 13CADQCh. 5 - When preparing cost estimates for account analysis...Ch. 5 - How can one compensate for the effects of price...Ch. 5 - Prob. 16CADQCh. 5 - Prob. 17CADQCh. 5 - A decision maker is interested in obtaining a cost...Ch. 5 - Consider the Business Application item Using...Ch. 5 - A friend comes to you with the following problem....Ch. 5 - After doing an account analysis and giving the...Ch. 5 - In doing cost analysis, you realize that there...Ch. 5 - Prob. 23CADQCh. 5 - Are learning curves likely to affect materials...Ch. 5 - McDonalds, the fast-food restaurant, is known for...Ch. 5 - Prob. 26CADQCh. 5 - A manager asks you for a cost estimate to open a...Ch. 5 - Prob. 28CADQCh. 5 - Methods of Estimating Costs: Engineering Estimates...Ch. 5 - Prob. 30ECh. 5 - Methods of Estimating Costs: Engineering Estimates...Ch. 5 - Prob. 32ECh. 5 - Methods of Estimating Costs: Account Analysis The...Ch. 5 - Methods of Estimating Costs: Account Analysis...Ch. 5 - Methods of Estimating Costs: High-Low, Ethical...Ch. 5 - Methods of Estimating Costs: High-Low Adriana...Ch. 5 - Methods of Estimating Costs: High-Low
Adriana...Ch. 5 - Prob. 38ECh. 5 - Adriana Corporation manufactures football...Ch. 5 - Methods of Estimating Costs: Simple...Ch. 5 - Prob. 41ECh. 5 - Methods of Estimating Costs: High-Low Davis Stores...Ch. 5 - Methods of Estimating Costs: Scattergraph Prepare...Ch. 5 - Prob. 44ECh. 5 - Interpretation of Regression Results: Multiple...Ch. 5 - Interpretation of Regression Results Brodie...Ch. 5 - Prob. 47ECh. 5 - Interpretation of Regression Results: Simple...Ch. 5 - Learning Curves Assume that General Dynamics,...Ch. 5 - Learning Curves Assume that Whee, Cheatham, and...Ch. 5 - Prob. 51ECh. 5 - Learning Curves (Appendix B) Refer to the example...Ch. 5 - Prob. 53PCh. 5 - Prob. 54PCh. 5 - Regressions from Published Data Obtain 13 years of...Ch. 5 - Prob. 56PCh. 5 - High-Low Method, Scattcrgraph Cubicle Solutions...Ch. 5 - High-Low Method, Scattcrgraph Academy Products...Ch. 5 - High-Low, Scattergraph, Issues with Data
Wyoming...Ch. 5 - Interpretation of Regression Results: Simple...Ch. 5 - Interpretation of Regression Results: Simple...Ch. 5 - Interpretation of Regression Results: Multiple...Ch. 5 - Interpretation of Regression Results: Simple...Ch. 5 - Interpretation of Regression Results Brews 4 U is...Ch. 5 - Cost Estimation: Simple Regression The following...Ch. 5 - Prob. 68PCh. 5 - Methods of Cost Analysis: Account Analysis, Simple...Ch. 5 - Learning Curves (Appendix B) Refer to the example...Ch. 5 - Learning Curves (Appendix B) Krylon Company...
Knowledge Booster


Learn more about
Need a deep-dive on the concept behind this application? Look no further. Learn more about this topic, accounting and related others by exploring similar questions and additional content below.Similar questions
- Dixie Showtime Movie Theaters, Inc., owns and operates a chain of cinemas in several markets in the southern United States. The owners would like to estimate weekly gross revenue as a function of advertising expenditures. Data for a sample of eight markets for a recent week follow: a. Develop an estimated regression equation with the amount of television advertising as the independent variable. Test for a significant relationship between television advertising and weekly gross revenue at the 0.05 level of significance. What is the interpretation of this relationship? b. How much of the variation in the sample values of weekly gross revenue does the model in part (a) explain? c. Develop an estimated regression equation with both television advertising and newspaper advertising as the independent variables. Test whether each of the regression parameters 0, 1, and 2 is equal to zero at a 0.05 level of significance. What are the correct interpretations of the estimated regression parameters? Are these interpretations reasonable? d. How much of the variation in the sample values of weekly gross revenue does the model in part (c) explain? e. Given the results in parts (a) and (c), what should your next step be? Explain. f. What are the managerial implications of these results?arrow_forwardEffects of Changes in Profits and Assets on Return on Investment (ROI) Fitness Fanatics is a regional chain of health clubs. The managers of the clubs, who have authority to make investments as needed, are evaluated based largely on return on investment (ROI). The company’s Springfield Club reported the following results for the past year: Required: The following questions are to be considered independently. Carry out all computations to two decimal places. 1. Compute the Springfield club’s return on investment (ROI). 2. Assume that the manager of the club is able to increase sales by $70,000 and that, as a result, net operating income increases by $18,200. Further assume that this is possible without any increase in average operating assets. What would be the club’s return on investment (ROI)? 3. Assume that the manager of the club is able to reduce expenses by $14,000 without any change in sales or average operating assets. What would be the club’s return on investment (ROI)? 4.…arrow_forwardRefer to Cornerstone Exercise 3.4 for data on Dohini Manufacturing Company’s purchasing cost and number of purchase orders.The controller for Dohini Manufacturing ran regression on the data, and the coefficients shown by the regression program are: Intercept 15,021 (rounded to the nearest dollar)X variable 1 9.74 (rounded to the nearest cent) Required: 1. Construct the cost formula for the purchasing activity showing the fixed cost and the vari-able rate. 2. If Dohini Manufacturing Company estimates that next month will have 430 purchaseorders, what is the total estimated purchasing cost for that month? (Round your answer tothe nearest dollar.)3. What if Dohini Manufacturing wants to estimate purchasing cost for the coming year andexpects 5,340 purchase orders? What will estimated total purchasing cost be? (Round youranswer to the nearest dollar.) What is the total fixed purchasing cost? Why doesn’t it equalthe fixed cost calculated in Requirement 1?arrow_forward
- After a few hours May’s computer is fixed. May uses the first 9 months of data and regression analysis to estimate the relationship between the quantity purchased and purchase costs of part #696. The regression line May obtains is as follows: y = $2,582.6 + 3.54X Evaluate the regression line using the criteria of economic plausibility, goodness of fit, and significance of the independent variable. Compare the regression equation to the equation based on the high-low method. Which is a better fit? Why?arrow_forwardExplaining why companies use performance evaluation systems Financial performance is measured in many ways. Requirements 1. Explain the difference between lag and lead indicators. 2. The following is a list of financial measures. Indicate whether each is a lag or a lead indicator: a. Income statement shows net income of $100,000 b. Listing of next week’s orders of $50,000 c. Trend showing that average hits on the redesigned Web site are increasing at 5% per week d. Price sheet from vendor reflecting that cost per pound of sugar for the next month is $2 e. Contract signed last month with large retail store that guarantees a minimum shelf space for Grandpa’s Overloaded Chocolate Cookies for the next yeararrow_forwardZNet Co. is a web-based retail company. The company reports the following for the past year. The company’s CEO believes that sales for next year will increase by 20% and both profit margin (%) and the level of average invested assets will be the same as for the past year. 1. Compute return on investment for the past year. 2. Compute profit margin for the past year. 3. If the CEO’s forecast is correct, what will return on investment equal for next year? 4. If the CEO’s forecast is correct, what will investment turnover equal for next year? Sales . $5,000,000 Operating income . $1,000,000 Average invested assets . $12,500,000arrow_forward
- A marketing professor at Givens College is interested in the relationship between hours spent studying and total points earned in a course. Data collected on 156 students who took the course last semester are provided in the tile MktHrsPts. Develop a scatter chart for these data. What does the scatter chart indicate about the relationship between total points earned and hours spent studying? Develop an estimated regression equation showing how total points earned is related to hours spent studying. What is the estimated regression model? Test whether each of the regression parameters β0 and β1 is equal to zero at a 0.01 level of significance. What are the correct interpretations of the estimated regression parameters? Are these interpretations reasonable? How much of the variation in the sample values of total point earned does the model you estimated in part (b) explain? Mark Sweeney spent 95 hours studying. Use the regression model you estimated in part (b) to predict the total points Mark earned.arrow_forwardThe controller for Dohini Manufacturing Company felt that the number of purchase orders alone did not explain the monthly purchasing cost. He knew that nonstandard orders (for example, one requiring an overseas supplier) took more time and effort. He collected data on the number of nonstandard orders for the past 12 months and added that information to the data on purchasing cost and total number of purchase orders. Multiple regression was run on the above data; the coefficients shown by the regression program are: Required: 1. Construct the cost formula for the purchasing activity showing the fixed cost and the variable rate. 2. If Dohini Manufacturing Company estimates that next month will have 430 total purchase orders and 45 nonstandard orders, what is the total estimated purchasing cost for that month? (Round your answer to the nearest dollar.) 3. What if Dohini Manufacturing wants to estimate purchasing cost for the coming year and expects 5,340 purchase orders and 580 nonstandard orders? What will estimated total purchasing cost be? What is the total fixed purchasing cost? Why doesnt it equal the fixed cost calculated in Requirement 2? (Round your answers to the nearest dollar.)arrow_forwardSouth Shore Construction builds permanent docks and seawalls along the southern shore of Long Island, New York. Although the firm has been in business only five years, revenue has increased from $308,000 in the first year of operation to $1,084,000 in the most recent year. The following data show the quarterly sales revenue in thousands of dollars: Construct a time series plot. What type of pattern exists in the data? Use a multiple regression model with dummy variables as follows to develop an equation to account for seasonal effects in the data: Qtr1 = 1 if quarter I, 0 otherwise; Qtr2 = 1 if quarter 2, 0 otherwise; Qtr3 = 1 if quarter 3, 0 otherwise. Based on the model you developed in part (b), compute estimates of quarterly sales for year 6. Let Period = 1 refer to the observation in quarter 1 of year 1; Period = 2 refer to the observation in quarter 2 of year 1; … and Period = 20 refer to the observation in quarter 4 of year 5. Using the dummy variables defined in part (b) and the variable Period, develop an equation to account for seasonal effects and any linear trend in the time series. Based on the seasonal effects in the data and linear trend estimated in part (c), compute estimates of quarterly sales for year 6. Is the model you developed in part (b) or the model you developed in part (d) more effective? Justify your answer.arrow_forward
- The quarterly sales data (number of copies sold) for a college textbook over the past three years are as follows: a. Construct a time series plot. What type of pattern exists in the data? b. Use a regression model with dummy variables as follows to develop an equation to account for seasonal effects in the data: Qtr1 = l if quarter l, 0 otherwise; Qtr2 = l if quarter 2, 0 otherwise; Qtr3 = 1 if quarter 3, 0 otherwise. c. Based on the model you developed in part (b), compute the quarterly forecasts for next year. d. Let t = 1 to refer to the observation in quarter 1 of year 1; t = 2 to refer to the observation in quarter 2 of year 1; ; and t = 12 to refer to the observation in quarter 4 of year 3. Using the dummy variables defined in part (b) and t, develop an equation to account for seasonal effects and any linear trend in the time series. e. Based upon the seasonal effects in the data and linear trend, compute the quarterly forecasts for next year. f. Is the model you developed in part (b) or the model you developed in part (d) more effective? Justify your answer.arrow_forwardAnalyzing profitability analysis, service company Burlington Internet Services is an Internet service provider for commercial and residential Customers. The company provided the following data for its two types of customers for the month of August: For each type of customer, determine both the contribution margin per customer and the contribution margin ratio. Round to twos decimal places. Which type of service and more profitable?arrow_forwardMeasure Maps Rizzo Goal Inc. produces and sells hockey equipment, often custom made for online orders. The company has the following performance metrics on its balanced scorecard: days from ordered to delivered, number of shipping errors, customer retention rate, and market share. A measure map illustrates that the days from ordered to delivered and the number of shipping errors are both expected to directly affect the customer retention rate, which affects market share. Additional internal analysis finds that: Every shipping error over 2 shipping errors per month reduces the customer retention rate by 2.5%. On average, each day above 2 days from ordered to delivered yields a reduction in the customer retention rate of 2%. Each day before 2 days from order to delivery yields an increase in the customer retention rate of 2%, on average. Rizzo Goal Inc.’s current customer retention rate is 70%. The company estimates that for every 2% increase or decrease in the customer retention rate,…arrow_forward
arrow_back_ios
SEE MORE QUESTIONS
arrow_forward_ios
Recommended textbooks for you
 Cornerstones of Cost Management (Cornerstones Ser...AccountingISBN:9781305970663Author:Don R. Hansen, Maryanne M. MowenPublisher:Cengage Learning
 Essentials of Business Analytics (MindTap Course ...StatisticsISBN:9781305627734Author:Jeffrey D. Camm, James J. Cochran, Michael J. Fry, Jeffrey W. Ohlmann, David R. AndersonPublisher:Cengage Learning
 Managerial AccountingAccountingISBN:9781337912020Author:Carl Warren, Ph.d. Cma William B. TaylerPublisher:South-Western College Pub
 Financial Accounting: The Impact on Decision Make...AccountingISBN:9781305654174Author:Gary A. Porter, Curtis L. NortonPublisher:Cengage Learning
Cornerstones of Cost Management (Cornerstones Ser...
Accounting
ISBN:9781305970663
Author:Don R. Hansen, Maryanne M. Mowen
Publisher:Cengage Learning
Essentials of Business Analytics (MindTap Course ...
Statistics
ISBN:9781305627734
Author:Jeffrey D. Camm, James J. Cochran, Michael J. Fry, Jeffrey W. Ohlmann, David R. Anderson
Publisher:Cengage Learning
Managerial Accounting
Accounting
ISBN:9781337912020
Author:Carl Warren, Ph.d. Cma William B. Tayler
Publisher:South-Western College Pub
Financial Accounting: The Impact on Decision Make...
Accounting
ISBN:9781305654174
Author:Gary A. Porter, Curtis L. Norton
Publisher:Cengage Learning
How to Estimate Project Costs: A Method for Cost Estimation; Author: Online PM Courses - Mike Clayton;https://www.youtube.com/watch?v=YQ2Wi3Jh3X0;License: Standard Youtube License