
Videos
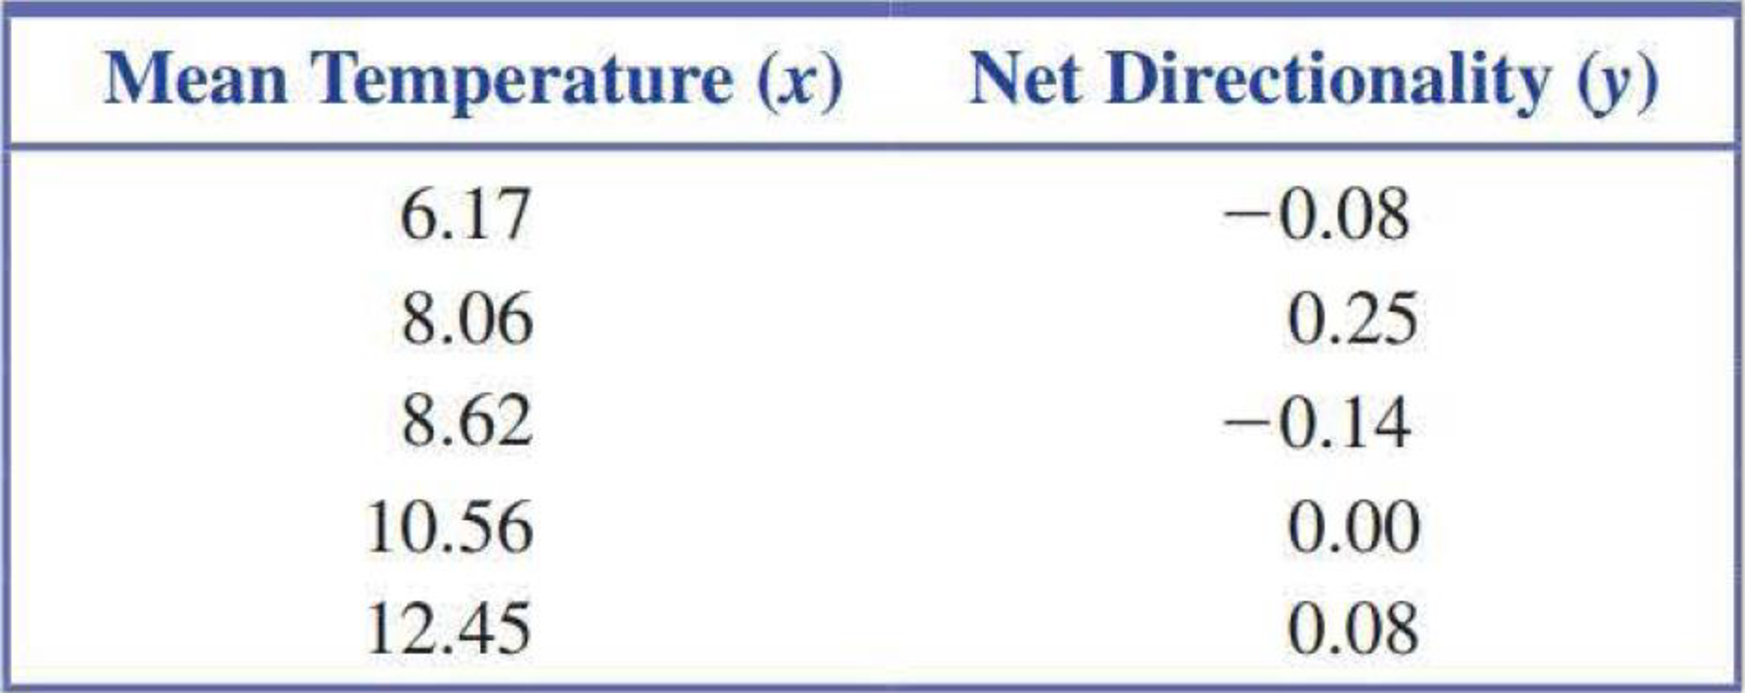
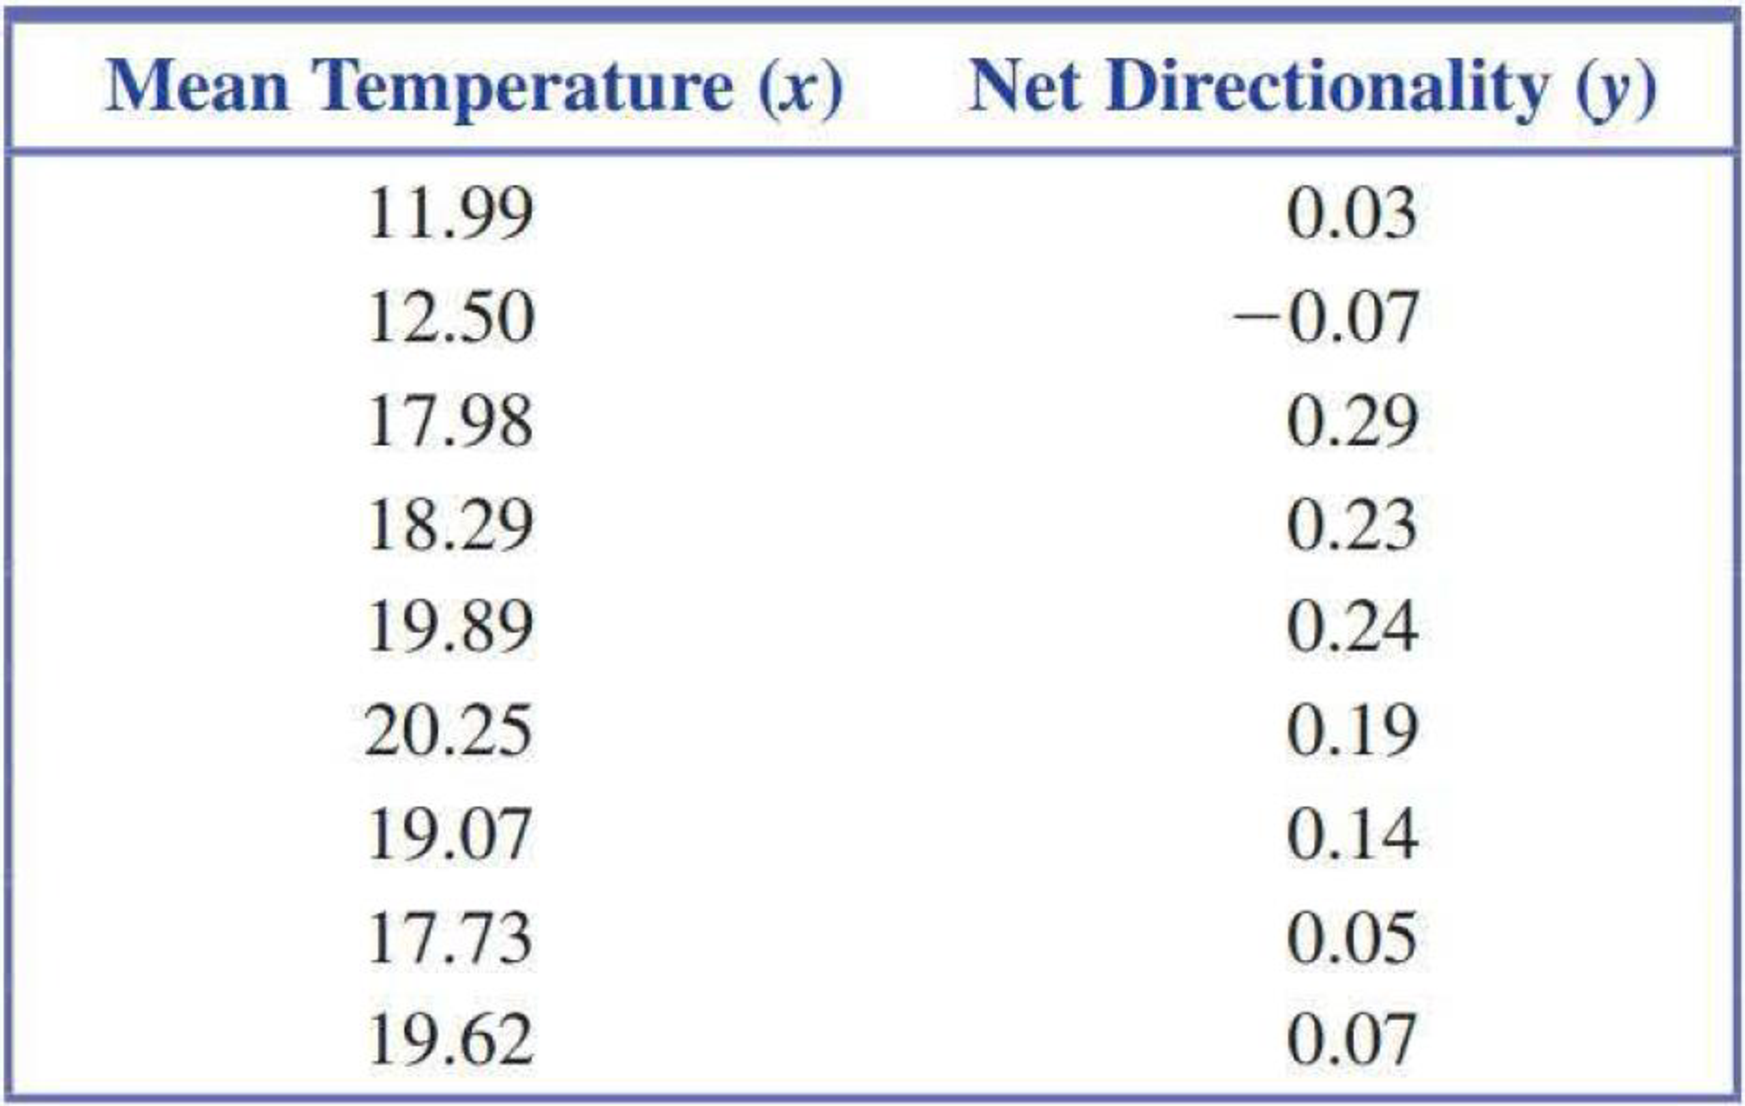
The authors of the paper “Evaluating Existing Movement Hypotheses in Linear Systems Using Larval Stream Salamanders” (Canadian Journal of Zoology [2009]: 292–298) investigated whether water temperature was related to how far a salamander would swim and whether it would swim upstream or downstream. Data for 14 streams with different
The two variables of interest are x = Mean water temperature (°C) and y = Net directionality, which was defined as the difference in the relative frequency of the released salamander larvae moving upstream and the relative frequency of released salamander larvae moving downstream. A positive value of net directionality means a higher proportion were moving upstream than downstream. A negative value of net directionality means a higher proportion were moving downstream than upstream.
- a. Construct a
scatterplot of the data. How would you describe the relationship between x and y? - b. Find the equation of the least-squares line describing the relationship between y = Net directionality and x = Mean water temperature.
- c. What value of net directionality would you predict for a stream that had mean water temperature of 15 °C?

Trending nowThis is a popular solution!

Chapter 5 Solutions
INTRODUCTION TO STATISTICS & DATA ANALYS
Additional Math Textbook Solutions
Elementary Statistics
Intro Stats, Books a la Carte Edition (5th Edition)
Elementary Statistics (Text Only)
Statistics for Business and Economics (13th Edition)
The Practice of Statistics for AP - 4th Edition
Applied Statistics in Business and Economics


- Consider a cohort study to compare the mortality rate of myocardial infarction (MI) in men with sedentary work (exposed group) to men with physically active work (unexposed). If in the exposed, there were 36,000 person (man) years of observation and 126 deaths whereas the unexposed had 24,000 man-years of observation and 44 deaths. Compute the following a) Mortality rate in each cohort? b) What is the relative risk of dying, comparing these 2 groups? c) What is the attributable risk of sedentary work? d) What is the attributable benefit of physical activity? e) If we assume that MI is associated with the mortality in this cohort (causality), what proportion of the disease in the higher group is potentially preventable?arrow_forwardThe article “Effects of Diets with Whole Plant-Origin Proteins Added with Different Ratiosof Taurine:Methionine on the Growth, Macrophage Activity and Antioxidant Capacity ofRainbow Trout (Oncorhynchus mykiss) Fingerlings” (O. Hernandez, L. Hernandez, et al.,Veterinary and Animal Science, 2017:4-9) reports that a sample of 210 juvenile rainbowtrout fed a diet fortified with equal amounts of the amino acids taurine and methionine for aperiod of 70 days had a mean weight gain of 313 percent with a standard deviation of 25, while 210 fish fed with a control diet had a mean weight gain of 233 percent with a standard deviation of 19. Units are percent. Find a 99% confidence interval for the difference in weight gain on the two diets.arrow_forwardIn a study attempting to replicate findings by Stephens, Atkins, & Kingston (2009), each participant was asked to plunge a hand into the icy water and keep it there as long as the pain would allow. In one condition, the participants repeated their favorite curse words while their hands were in the water. In the other condition, they repeated neutral words. The original research showed that, in addition to lowering the participants’ perception of pain, swearing also increased the amount of time they were able to tolerate the pain. Data similar to the results obtained in the study are shown in the following table: _____________Amount of Time (in Seconds)_ Participant Swear Words Neutral Words 1 94 59 2 70 61 3 52 47 4…arrow_forward
- In a study attempting to replicate findings by Stephens, Atkins, & Kingston (2009), each participant was asked to plunge a hand into the icy water and keep it there as long as the pain would allow. In one condition, the participants repeated their favorite curse words while their hands were in the water. In the other condition, they repeated neutral words. The original research showed that, in addition to lowering the participants’ perception of pain, swearing also increased the amount of time they were able to tolerate the pain. Data similar to the results obtained in the study are shown in the following table: _____________Amount of Time (in Seconds)_ Participant Swear Words Neutral Words 1 94 59 2 70 61 3 52 47 4…arrow_forwardAn automotive engineer is investigating two different types of metering devices for an electronic fuel injection system to determine whether they differ in their fuel mileage performance. The system is installed on 10 different cars, and a test is run with each metering device on each car. The data is provided below: Metering Device Car 1 2 1 17.6 16.8 2 19.4 20.0 3 18.2 17.6 4 17.1 16.4 5 15.3 16.0 6 15.9 15.9 7 16.3 16.5 8 18.0 18.4 9 17.3 16.4 10 19.1 20.1 Is there a significant difference between the means of the two metering devices? Use . Interpret the result in the context of the problem. An article in the journal Hazardous Waste and Hazardous Materials (Vol. 6, 1989) reported the results of an analysis of the weight of calcium in standard cement and cement doped with lead. Reduced levels of calcium would indicate that the hydration mechanism in the cement is blocked…arrow_forwardA U.S. Food Survey showed that Americans routinely eat beef in their diet. Suppose that in a study of 49 consumers in Illinois and 64 consumers in Texas the following results were obtained from two samples regarding average yearly beef consumption: Illinois Texas = 49 = 64 = 54.1lb = 60.4lb S1 = 7.0 S2 = 8.0 Formulate a hypothesis so that, if the null hypothesis is rejected, we can conclude that the average amount of beef eaten annually by consumers in Illinois is significantly less than that eaten by consumers in Texas.arrow_forward
- A sociologist recorded the number of contacts entered in a cell phone and the number of texts sent in a week for 20 cell phone users. The resulting data were used to conduct a hypothesis test to investigate whether there is a linear relationship between the number of contacts and the number of texts sent. What are the correct hypotheses for the test? H0:β1=0Ha:β1≠0H0:β1=0Ha:β1≠0 A H0:β1=0Ha:β1>0H0:β1=0Ha:β1>0 B H0:β1=0Ha:β1<0H0:β1=0Ha:β1<0 C H0:β1≠0Ha:β1=0H0:β1≠0Ha:β1=0 D H0:b1=0Ha:b1≠0 Earrow_forwardA paper investigated the driving behavior of teenagers by observing their vehicles as they left a high school parking lot and then again at a site approximately 1 2 mile from the school. Assume that it is reasonable to regard the teen drivers in this study as representative of the population of teen drivers. MaleDriver FemaleDriver 1.3 -0.3 1.3 0.6 0.9 1.1 2.1 0.7 0.7 1.1 1.3 1.2 3 0.1 1.3 0.9 0.6 0.5 2.1 0.5 (a) Use a .01 level of significance for any hypothesis tests. Data consistent with summary quantities appearing in the paper are given in the table. The measurements represent the difference between the observed vehicle speed and the posted speed limit (in miles per hour) for a sample of male teenage drivers and a sample of female teenage drivers. (Use ?males − ?females. Round your test statistic to two decimal places. Round your degrees of freedom down to the nearest whole number. Round your p-value to three decimal places.) t = df =…arrow_forwardA paper investigated the driving behavior of teenagers by observing their vehicles as they left a high school parking lot and then again at a site approximately 1 2 mile from the school. Assume that it is reasonable to regard the teen drivers in this study as representative of the population of teen drivers. MaleDriver FemaleDriver 1.4 -0.2 1.2 0.5 0.9 1.1 2.1 0.7 0.7 1.1 1.3 1.2 3 0.1 1.3 0.9 0.6 0.5 2.1 0.5 (a) Use a .01 level of significance for any hypothesis tests. Data consistent with summary quantities appearing in the paper are given in the table. The measurements represent the difference between the observed vehicle speed and the posted speed limit (in miles per hour) for a sample of male teenage drivers and a sample of female teenage drivers. (Use ?males − ?females. Round your test statistic to two decimal places. Round your degrees of freedom down to the nearest whole number. Round your p-value to three decimal places.) t = df =…arrow_forward
- A survey of high school students was done to examine whether students had ever driven a car after consuming a substantial amount of alcohol (1=yes, 0=no). Data was collected on their sex (male/female), race (White/non-White), and grade level (9,10,11,12). Researchers realized that the impact of race on consuming alcohol before driving might vary by grade level and decided to fit the following model. Variable Coding = 1 if Intercept Sex () Female Race () Black Grade level ( 9th grade 10th grade 11th grade [Reference = 12th grade] Attached is the logistic model 1. Compute the OR of drinking before driving for students who self-reported as Black versus non-Black in the 9th grade, adjusting for gender. 2. Compute the OR of drinking before driving for students who self-reported as Black versus non-Black in the 12th grade, adjusting for gender. 3. Compute the OR of drinking before driving for someone in the 9th grade versus 12th grade for a student who…arrow_forwardConsider the following datax -5 -4 -3 -2 -1 0 1 2 3 4 5Y - 125 - 64 - 27 -8 -1 0 1 8 27 64 125a. Calculate the correlation between x and y, and perform a hypothesis test to determine if the correlation is significantly greater than zero. Use a significance level of 5%.b. Are you willing to conclude that there is a strong linear association between the two variables? Use at least one graph to support your answer, and to explain why or why not.arrow_forwardA researcher notes that there seems to be a difference in the prevalence of individuals who are medication adherent and have high levels of education along with a high health literacy and the prevalence of individuals who are not medication adherent and have low levels of education along with a low health literacy. Use the appropriate hypothesis to determine if education level and health literacy status are related (independent) at the 5%. Low Level of Education Low Medication Adherence High Medication Adherence Total Low Health Literacy 91 9 100 High Health Literacy 9 291 300 Total 100 300 400 High Level of Education Low Medication Adherence High Medication Adherence Total Low Health Literacy 96 4 100 High Health Literacy 4 296 300 Total 100 300 400arrow_forward
 Linear Algebra: A Modern IntroductionAlgebraISBN:9781285463247Author:David PoolePublisher:Cengage Learning