
Videos
Determining the age of an animal can sometimes be a difficult task. One method of estimating the age of harp seals is based on the width of the pulp canal in the canine teeth. To investigate the relationship between age and the width of the pulp canal, researchers recorded age and canal width in seals of known age. The following data on x = Age (in years) and y = Canal length (in millimeters) are a portion of a larger data set that appeared in the paper “Validation of Age Estimation in the Harp Seal Using Dentinal Annuli” (Canadian Journal of Fisheries and Aquatic Science [1983]: 1430–1441):
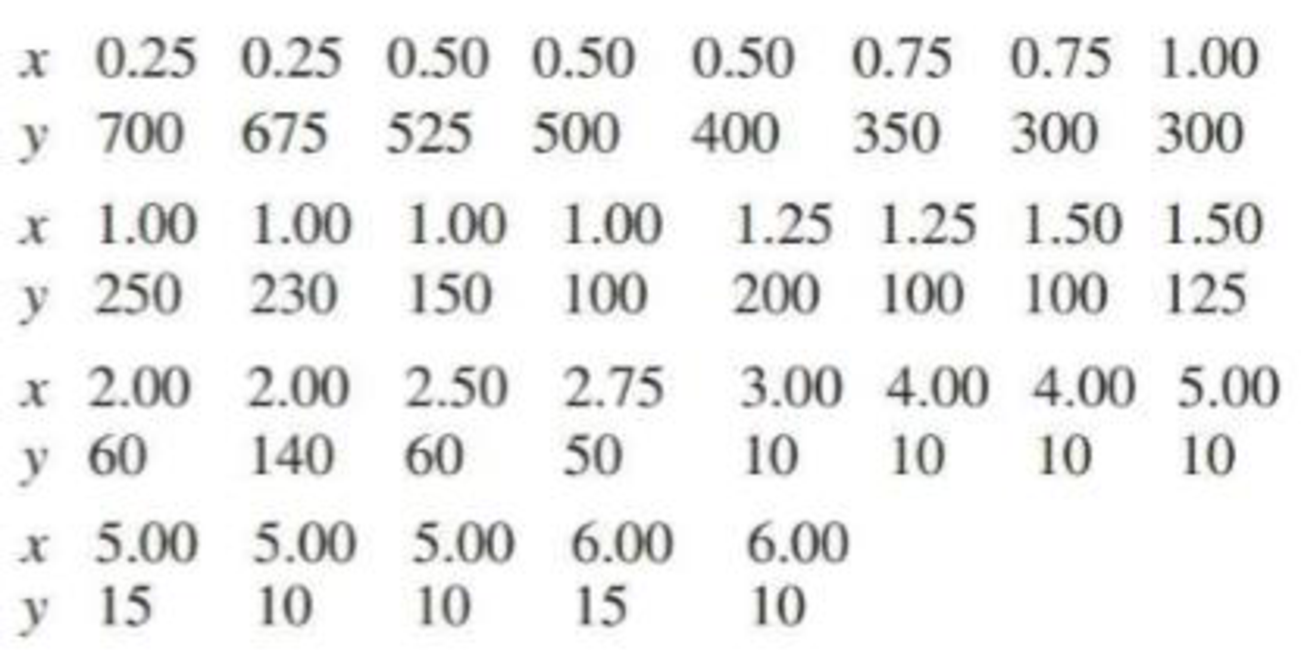
Construct a
Want to see the full answer?
Check out a sample textbook solution
Chapter 5 Solutions
INTRODUCTION TO STATISTICS & DATA ANALYS


- Find the equation of the regression line for the following data set. x 1 2 3 y 0 3 4arrow_forwardDoes Table 1 represent a linear function? If so, finda linear equation that models the data.arrow_forwardThe table below shows the number of state-registered automatic weapons and the murder rate for several Northwestern states. xx 11.3 8.5 7.1 3.8 2.5 2.5 2.7 0.9 yy 13.7 11.2 10.2 7 6.3 6.3 6.3 5.1 xx = thousands of automatic weaponsyy = murders per 100,000 residentsThe equation y=4.14+0.84xy=4.14+0.84x can used to model this data. Use this equation to answer the following;Special Note: I suggest you verify this equation by performing linear regression on your calculator.A) How many murders per 100,000 residents can be expected in a state with 1.8 thousand automatic weapons?Answer = Round to 3 decimal places.B) How many murders per 100,000 residents can be expected in a state with 10 thousand automatic weapons?Answer = Round to 3 decimal places.arrow_forward
- ***given the calculations, how do I apply it to the data taken?***arrow_forwardA study is made for a particular allergy medication in order to determine the length of relief it provides Y (in hours) in relation to the dosage of medication X (in mg). For this reason, ten patients were given different doses of the medication and were asked to report back when the medication seemed to wear off. Patient #1 #2 #3 #4 #5 #6 #7 #8 #9 #10 Dosage (x) Relief Hours (y) 3 3.5 4 5 6 6.5 7 8 8.5 9 9.1 5.5 12.3 9.2 14.2 16.8 22.0 18.3 24.5 22.7 (i) Draw a scatter diagram. (ii) Calculate the product moment correlation coefficient and comment on your answer. (iii) Construct the least squares regression line.arrow_forward
 Algebra & Trigonometry with Analytic GeometryAlgebraISBN:9781133382119Author:SwokowskiPublisher:Cengage
 Mathematics For Machine TechnologyAdvanced MathISBN:9781337798310Author:Peterson, John.Publisher:Cengage Learning,
 Functions and Change: A Modeling Approach to Coll...AlgebraISBN:9781337111348Author:Bruce Crauder, Benny Evans, Alan NoellPublisher:Cengage Learning
 Glencoe Algebra 1, Student Edition, 9780079039897...AlgebraISBN:9780079039897Author:CarterPublisher:McGraw Hill