
INTRODUCTION TO STATISTICS & DATA ANALYS
6th Edition
ISBN: 9780357420447
Author: PECK
Publisher: CENGAGE L
expand_more
expand_more
format_list_bulleted
Videos
Textbook Question
Chapter 5.4, Problem 58E
A study, described in the paper “Prediction of Defibrillation Success from a Single Defibrillation Threshold Measurement” (Circulation [1988]: 1144–1149) investigated the relationship between defibrillation success and the energy of the defibrillation shock (expressed as a multiple of the defibrillation threshold). The accompanying data are from this study.
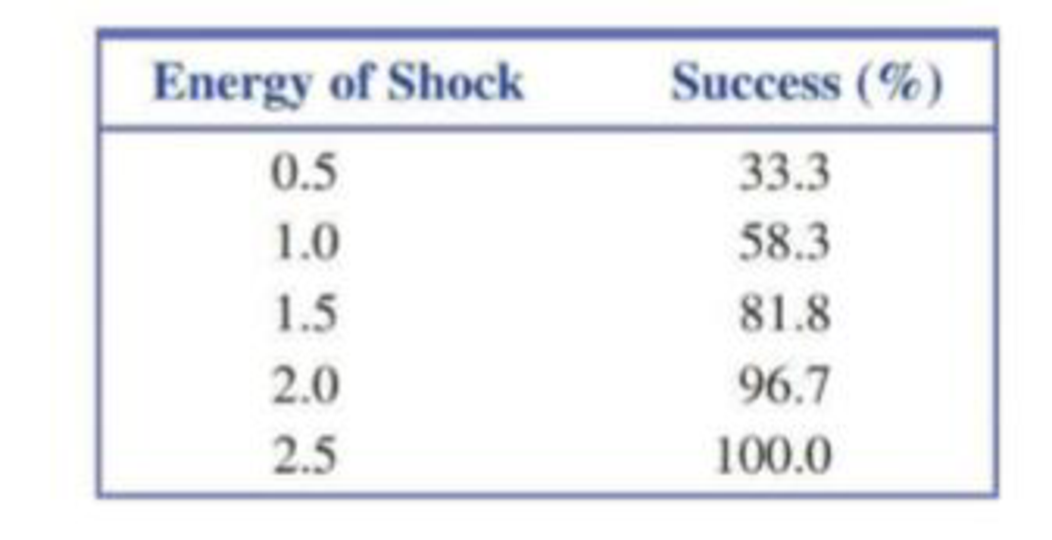
- a. Construct a
scatterplot of y = Success and x = Energy of shock. Does the relationship appear to be linear or nonlinear? - b. Fit a least-squares line to the given data, and construct a residual plot. Does the residual plot support your conclusion in Part (a)? Explain.
Expert Solution & Answer
Want to see the full answer?
Check out a sample textbook solution
Students have asked these similar questions
Researchers interested in lead exposure due to car exhaust sampled the blood of 52 police officers subjected to constant inhalation of automobile exhaust fumes while working traffic enforcement in a primarily urban environment. The blood samples of these officers had an average lead concentration of 124.32 µg/l and a SD of 37.74 µg/l; a previous study of individuals from a nearby suburb, with no history of exposure, found an average blood level concentration of 35 µg/l.
Test the hypothesis that the downtown police officers have a higher lead exposure than the group in the previous study. Interpret your results in context.
Based on your preceding result, without performing a calculation, would a 99% confidence interval for the average blood concentration level of police officers contain 35 µg/l?
Based on your preceding result, without performing a calculation, would a 99% confidence interval for this difference contain 0? Explain why or why not.
The article “Withdrawal Strength of Threaded Nails” (D. Rammer, S. Winistorfer, and D. Bender, Journal of Structural Engineering 2001:442–449) describes an experiment comparing the ultimate withdrawal strengths (in N/mm) for several types of nails. For an annularly threaded nail with shank diameter 3.76 mm driven into spruce-pine-fir lumber, the ultimate withdrawal strength was modeled as lognormal with μ = 3.82 and σ = 0.219. For a helically threaded nail under the same conditions, the strength was modeled as lognormal with μ = 3.47 and σ = 0.272. a) What is the mean withdrawal strength for annularly threaded nails? b) What is the mean withdrawal strength for helically threaded nails? c) For which type of nail is it more probable that the withdrawal strength will be greater than 50 N/mm? d) What is the probability that a helically threaded nail will have a greater withdrawal strength than the median for annularly threaded nails? e) An experiment is performed in which withdrawal…
The article “Effect of Varying Solids Concentration and Organic Loading on the Performance of Temperature Phased Anaerobic Digestion Process” (S. Vandenburgh and T. Ellis, Water Environment Research, 2002:142–148) discusses experiments to determine the effect of the solids concentration on the performance of treatment methods for wastewater sludge. In the first experiment, the concentration of solids (in g/L) was 43.94 ± 1.18. In the second experiment, which was independent of the first, the concentration was 48.66 ± 1.76. Estimate the difference in the concentration between the two experiments, and find the uncertainty in the estimate.
Chapter 5 Solutions
INTRODUCTION TO STATISTICS & DATA ANALYS
Ch. 5.1 - For each of the scatterplots shown, answer the...Ch. 5.1 - For each of the following pairs of variables,...Ch. 5.1 - For each of the following pairs of variables,...Ch. 5.1 - For each of the following pairs of variables,...Ch. 5.1 - Is the following statement correct? Explain why or...Ch. 5.1 - Draw a scatterplot for which r = 1.Ch. 5.1 - Draw a scatterplot for which r = 1.Ch. 5.1 - Each year J.D. Power and Associates surveys new...Ch. 5.1 - The accompanying data are x = Cost (cents per...Ch. 5.1 - The authors of the paper Flat-footedness Is Not a...
Ch. 5.1 - The paper The Relationship Between Cell Phone Use,...Ch. 5.1 - Data from the U.S. Federal Reserve Board (federal...Ch. 5.1 - The article 115K! The 13 Best Paying U.S....Ch. 5.1 - It may seem odd, but one of the ways biologists...Ch. 5.1 - An auction house released a list of 25 recently...Ch. 5.1 - A sample of automobiles traversing a certain...Ch. 5.2 - Two scatterplots are shown below. Explain why it...Ch. 5.2 - The authors of the paper Statistical Methods for...Ch. 5.2 - The accompanying data are a subset of data from...Ch. 5.2 - The authors of the paper Evaluating Existing...Ch. 5.2 - The authors of the paper referenced in the...Ch. 5.2 - A sample of 548 ethnically diverse students from...Ch. 5.2 - The relationship between hospital patient-to-nurse...Ch. 5.2 - The report Airline Quality Rating 2016...Ch. 5.2 - Acrylamide is a chemical that is sometimes found...Ch. 5.2 - Use the acrylamide data given in the previous...Ch. 5.2 - Studies have shown that people who suffer sudden...Ch. 5.2 - The data given in the previous exercise on x =...Ch. 5.2 - An article on the cost of housing in Califomia...Ch. 5.2 - The following data on sale price, size, and...Ch. 5.2 - Explain why it can be dangerous to use the...Ch. 5.2 - The sales manager of a large company selected a...Ch. 5.2 - Explain why the slope b of the least-squares line...Ch. 5.2 - Prob. 34ECh. 5.3 - Does it pay to stay in school? The report Trends...Ch. 5.3 - The data in the accompanying table is from the...Ch. 5.3 - The paper referenced in the previous exercise also...Ch. 5.3 - Consider the residual plot from the previous...Ch. 5.3 - The report Airline Quality Rating 2016...Ch. 5.3 - Acrylamide is a chemical that is sometimes found...Ch. 5.3 - Consider the scatterplot of acrylamide...Ch. 5.3 - Some types of algae have the potential to cause...Ch. 5.3 - The relationship between x = Total number of...Ch. 5.3 - The residuals from the least-squares line for the...Ch. 5.3 - The first Batman movie was made over 50 years ago...Ch. 5.3 - The article 115K! The 13 Best Paying U.S....Ch. 5.3 - The article Examined Life: What Stanley H. Kaplan...Ch. 5.3 - The accompanying data are a subset of data from...Ch. 5.3 - The article California State Parks Closure List...Ch. 5.3 - The article referenced in the previous exercise...Ch. 5.3 - A study was carried out to investigate the...Ch. 5.3 - Both r2 and se are used to assess the fit of a...Ch. 5.3 - Prob. 53ECh. 5.4 - The following data on x = Frying time (in seconds)...Ch. 5.4 - Use the information provided in the previous...Ch. 5.4 - The paper Aspects of Food Finding by Wintering...Ch. 5.4 - Food intake of grazing animals is limited by the...Ch. 5.4 - A study, described in the paper Prediction of...Ch. 5.4 - Prob. 59ECh. 5.4 - The following table gives the number of heart...Ch. 5.4 - Refer to the heart transplant data given in the...Ch. 5.4 - The paper Population Pressure and Agricultural...Ch. 5.4 - Determining the age of an animal can sometimes be...Ch. 5.5 - The paper How Lead Exposure Relates to Temporal...Ch. 5.5 - The following quote is from the paper Evaluation...Ch. 5 - The accompanying data represent x = Amount of...Ch. 5 - The paper A Cross-National Relationship Between...Ch. 5 - The following data on x = Score on a measure of...Ch. 5 - The paper Effects of Canine Parvovirus (CPV) on...Ch. 5 - The paper Depression, Body Mass Index, and Chronic...Ch. 5 - The paper Aspects of Food Finding by Wintering...Ch. 5 - Data on salmon availability (x) and the percentage...Ch. 5 - No tortilla chip lover likes soggy chips, so it is...Ch. 5 - The article Reduction is Soluble Protein and...Ch. 5 - The following quote is from the paper The Weight...Ch. 5 - An accurate assessment of oxygen consumption...Ch. 5 - Consider the four (x, y) pairs (0, 0), (1, 1), 1,...Ch. 5 - Prob. 1CRECh. 5 - Data from a survey of 1046 adults age 50 and older...Ch. 5 - Prob. 3CRECh. 5 - Prob. 4CRECh. 5 - Prob. 5CRECh. 5 - The amount of money spent each year on science,...Ch. 5 - Below are the data used to construct the time...Ch. 5 - In August 2009, Harris Interactive released the...Ch. 5 - Prob. 9CRECh. 5 - Prob. 10CRECh. 5 - Prob. 11CRECh. 5 - Prob. 12CRECh. 5 - Cost-to-charge ratios (the percentage of the...Ch. 5 - In the article Reproductive Biology of the Aquatic...Ch. 5 - Prob. 15CRECh. 5 - Anabolic steroid abuse has been increasing despite...Ch. 5 - Prob. 81ECh. 5 - Prob. 82ECh. 5 - Prob. 83ECh. 5 - Prob. 84ECh. 5 - Suppose the hypothetical data below are from a...Ch. 5 - Prob. 86E
Knowledge Booster


Learn more about
Need a deep-dive on the concept behind this application? Look no further. Learn more about this topic, statistics and related others by exploring similar questions and additional content below.Similar questions
- The article in the ASCE Journal of Energy Engineering (1999, Vol. 125, pp.59-75) describes a study of the thermal inertia properties of autoclaved aerated concrete used as a building material. Five samples of the material were tested in a structure, and the average interior temperatures (°C) reported were as follows: 23.01, 22.22, 22.04, 22.62, and 22.59. Test that the average interior temperature is equal to 22.5°C using alpha (a) = 0.05. This problem is a test on what population parameter? What is the null and alternative hypothesis? What are the Significance level and type of test? What standardized test statistic will be used? What is the standard test statistic? What is the Statistical Decision? What is the statistical decision in the statement form?arrow_forwardAn article in the Journal of Applied Polymer Science (Vol. 56, pp. 471–476, 1995) studied the effect of the mole ratio of sebacic acid on the intrinsic viscosity of copolyesters.- The data follows: Viscosity 0.45 0.2 0.34 0.58 0.7 0.57 0.55 0.44 Mole ratio 1 0.9 0.8 0.7 0.6 0.5 0.4 0.3 (a) Construct a scatter diagram of the data.arrow_forwardThe following data are from a random sample of 10 students who participated in a study undertaken to investigate the effect of sleep time (measured in average number of hours of sleep per night) on GPA (grade point average, measured on a 4-point scale). Student Sleep time GPA 1 7 3.28 2 9 3.16 3 8 3.75 4 6 2.50 5 4 2.45 6 8 2.91 7 7 3.53 8 6 3.02 9 3 2.30 10 8 3.48 a. Find the equation between GPA (y) as function of sleep time (x). b. What is the estimated GPA of a student who averages 5 hours of sleep per night? c. What is the coefficient of determination? *(no use EXCEL)arrow_forward
- A researcher hypothesizes that in a certain country the net annual growth of private sector purchases of government bonds, B, is positively related to the nominal rate of interest on the bonds, NI, and negatively related to the rate of inflation Π: Bt = a0 + a1NIt + a2Π t + ut Note that it may be hypothesized that B depends on the real rate of interest on bonds, R, where R = NI – Π. Using a sample of 56 annual observations, s/he estimates the following equations: (1) Bt = 0.43 + 0.90NIt - 0.97Πt R21 = 0.962, SSR1 = 2.20, QRESET(F1,52) = 16.6 (3.58) (8.80) (-1.05) (2) Bt = 0.44 + 0.94Rt R22 = 0.960, SSR2 = 2.22, QRESET(F1,53) = 0.9 (9.70) (16.7) (3) Bt = 0.44 + 1.14NIt SSR3 = 9.20, QRESET(F1,53) = 59.9 (8.84) (36.1) (4) NIt = 0.08 + 0.94Πt R24 = 0.997, SSR4 = 0.18, QRESET(F1,53) = 1.4…arrow_forwardA deficiency of the trace element selenium in the diet can negatively impact growth, immunity, muscle and neuromuscular function, and fertility. The introduction of selenium supplements to dairy cows is justified when pastures have low selenium levels. Authors of the article “Effects of Short-Term Supplementation with Selenised Yeast on Milk Production and Composition of Lactating Cows” (Australian J. of Dairy Tech., 2004: 199–203) supplied the following data on milk selenium concentration (mg/L) for a sample of cows given a selenium supplement and a control sample given no supplement, both initially and after a 9-day period. Obs Init Se Init Cont Final Se Final Cont 1 11.4 9.1 138.3 9.3 2 9.6 8.7 104 8.8 3 10.1 9.7 96.4 8.8 4 8.5 10.8 89 10.1 5 10.3 10.9 88 9.6 6 10.6 10.6 103.8 8.6 7 11.8 10.1 147.3 10.4 8 9.8 12.3 97.1 12.4 9 10.9 8.8 172.6 9.3 10 10.3…arrow_forwardRefer to Exercise 8.S.6. Analyze these data using a Wilcoxon signed-rank test.arrow_forward
- In a typical multiple linear regression model where x1 and x2 are non-random regressors, the expected value of the response variable y given x1 and x2 is denoted by E(y | 2,, X2). Build a multiple linear regression model for E (y | *,, *2) such that the value of E(y | x1, X2) may change as the value of x2 changes but the change in the value of E(y | X1, X2) may differ in the value of x1 . How can such a potential difference be tested and estimated statistically?arrow_forwardThe Turbine Oil Oxidation Test (TOST) and the Rotating Bomb Oxidation Test (RBOT) are two different procedures for evaluating the oxidation stability of steam turbine oils. An article reported the accompanying observations on x = TOST time (hr) and y = RBOT time (min) for 12 oil specimens. TOST 4200 3600 3750 3650 4050 2770 RBOT 370 345 375 315 350 205 TOST 4870 4525 3450 2700 3750 3325 RBOT 400 380 285 220 345 290 (a) Calculate the value of the sample correlation coefficient. (Round your answer to four decimal places.) r = Carry out a test of hypotheses to decide whether RBOT Time and TOST time are linearly related. (Use ? = 0.05.) Calculate the test statistic and determine the P-value. (Round your test statistic to two decimal places and your P-value to three decimal places.) t = P-value =arrow_forwardConsider the following measurements of blood hemoglobin concentrations (in g/dL) from three human populations at different geographic locations: population1 = [ 14.7 , 15.22, 15.28, 16.58, 15.10 ] population2 = [ 15.66, 15.91, 14.41, 14.73, 15.09] population3 = [ 17.12, 16.42, 16.43, 17.33] What is the standard error of the difference between the means of population 1 and population 2, needed to calculate the Tukey-Kramer q-statistic? What is the Tukey-Kramer q-statistic for populations 1 and 2? (Report the absolute value, if you get a negative number, multiply by -1)arrow_forward
- rofessor Cornish studied rainfall cycles and sunspot cycles. (Reference: Australian Journal of Physics, Vol. 7, pp. 334-346.) Part of the data include amount of rain (in mm) for 6-day intervals. The following data give rain amounts for consecutive 6-day intervals at Adelaide, South Australia. 7 28 7 1 69 3 1 4 22 7 16 4 54 160 60 73 27 3 3 1 7 144 107 4 91 44 1 8 4 22 4 59 116 52 4 155 42 24 11 43 3 24 19 74 26 63 110 39 34 71 52 39 8 0 15 2 14 9 1 2 4 9 6 10 (i) Find the median. (Use 1 decimal place.)(ii) Convert this sequence of numbers to a sequence of symbols A and B, where A indicates a value above the median and B a value below the median. Test the sequence for randomness about the median at the 5% level of significance. (b) Find the number of runs R, n1, and n2. Let n1 = number of values above the median and n2 = number of values below the median. R n1 n2 (c) In the case, n1 > 20, we cannot use Table 10 of Appendix II to find the critical…arrow_forwardThe following partial JMP regression output for the Fresh detergent data relates to predicting demand for future sales periods in which the price difference will be .10. SE Fit = .165360573, s = .628152. Predicted Demand Lower 95% MeanDemand Upper 95% MeanDemand 31 8.181072245 7.842346262 8.519798229 StdErr IndivDemand Lower 95% IndivDemand Upper 95% MeanDemand 0.649552965 6.850522511 9.511621980 Click here for the Excel Data File (a) Report a point estimate of and a 95 percent confidence interval for the mean demand for Fresh in all sales periods when the price difference is .10. (Round your CI answers to 3 decimal places and other answer to 4 decimal places.) (b) Report a point prediction of and a 95 percent prediction interval for the actual demand for Fresh in an individual sales period when the price difference is .10. (Round your PI answers to 3 decimal places and other answer to 4 decimal places.) (c) StdErr Indiv Demand on…arrow_forwardResearchers interested in lead exposure due to car exhaust sampled the blood of 52 police officers subjected to constant inhalation of automobile exhaust fumes while working traffic enforcement in a primarily urban environment. The blood samples of these officers had an average lead concentration of 124.32 µg/l and a SD of 37.74 µg/l; a previous study of individuals from a nearby suburb, with no history of exposure, found an average blood level concentration of 35 µg/l. Based on your preceding result, without performing a calculation, would a 99% confidence interval for the average blood concentration level of police officers contain 35 µg/l? Based on your preceding result, without performing a calculation, would a 99% confidence interval for this difference contain 0? Explain why or why not.arrow_forward
arrow_back_ios
SEE MORE QUESTIONS
arrow_forward_ios
Recommended textbooks for you
 Glencoe Algebra 1, Student Edition, 9780079039897...AlgebraISBN:9780079039897Author:CarterPublisher:McGraw Hill
Glencoe Algebra 1, Student Edition, 9780079039897...
Algebra
ISBN:9780079039897
Author:Carter
Publisher:McGraw Hill
Hypothesis Testing using Confidence Interval Approach; Author: BUM2413 Applied Statistics UMP;https://www.youtube.com/watch?v=Hq1l3e9pLyY;License: Standard YouTube License, CC-BY
Hypothesis Testing - Difference of Two Means - Student's -Distribution & Normal Distribution; Author: The Organic Chemistry Tutor;https://www.youtube.com/watch?v=UcZwyzwWU7o;License: Standard Youtube License