
INTRODUCTION TO STATISTICS & DATA ANALYS
6th Edition
ISBN: 9780357420447
Author: PECK
Publisher: CENGAGE L
expand_more
expand_more
format_list_bulleted
Concept explainers
Videos
Textbook Question
Chapter 5.3, Problem 39E
The report “Airline Quality Rating 2016” (airlinequalityrating.com/reports/2016_AQR_Final.pdf, retrieved April 22, 2017) included the data for 13 U.S. airlines given in the table below.
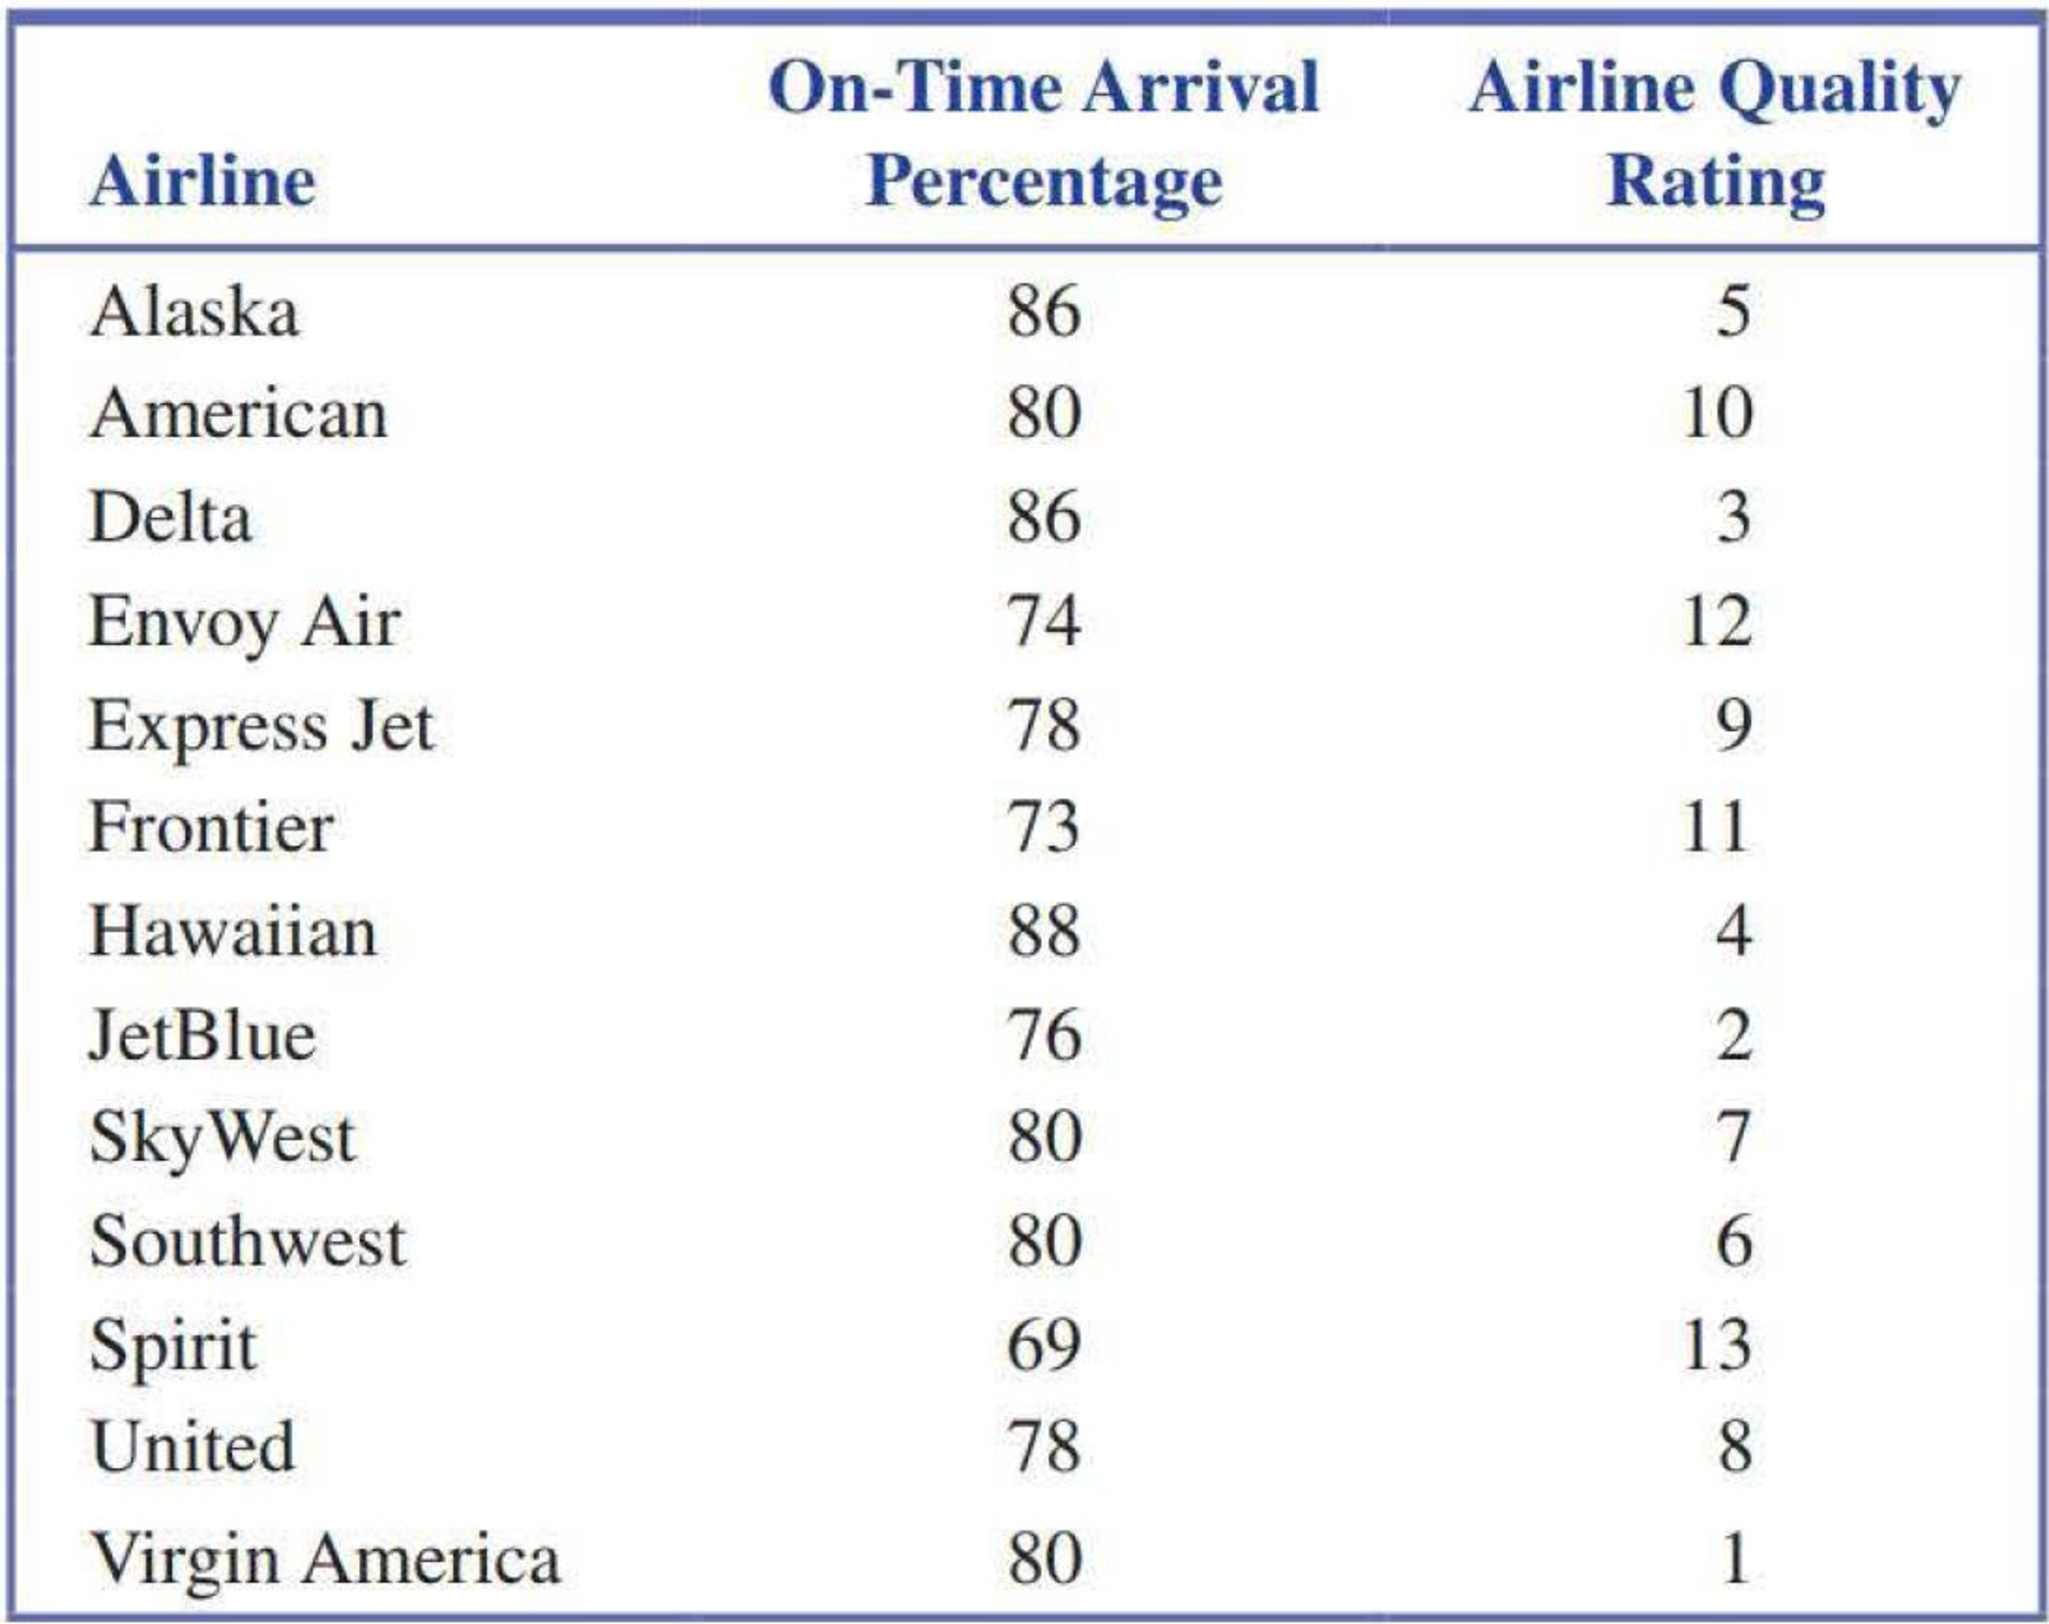
- a. With x = Airline quality rating and y = On-time arrival percentage, construct a
scatterplot . Does the pattern in the scatterplot look linear? - b. Find the equation of the least-squares line.
- c. Calculate the residuals and construct a residual plot. Are there any unusual features in the residual plot?
Expert Solution & Answer

Trending nowThis is a popular solution!

Students have asked these similar questions
The report “airline Quality rating 2016” (www.airlinequalityrating.com/reports/2016_aQr_Final.pdf,retrieved april 22, 2017) included the accompanying data onthe on-time arrival percentage and the number of complaintsfiles per 100,000 passengers for U.S. airlines.The report did not include data on the number of complaintsfor two of the airlines. Use the given data from the otherairlines to fit the least squares regression line and use it topredict the number of complaints per 100,000 passengersfor Spirit and for Virgin America.
An article included a summary of findings regarding the use of SAT I scores, SAT II scores, and high school grade point average (GPA) to predict first-year college GPA. The article states that "among these, SAT II scores are the best predictor, explaining 17 percent of the variance in first-year college grades. GPA was second at 15.2 percent, and SAT I was last at 13.1 percent." If the data from this study were used to fit a least squares line with y = first-year college GPA and x = high school GPA, what would the value of r2 have been?
R2 ____________________%
A coffee company uses a data-based approach to improving the quality and customer satisfaction of its products. When survey data indicated that the coffee company needed to improve its package-sealing process, an experiment was conducted to determine the factors in the bag-sealing equipment that might be affecting the ease of opening the bag without tearing the inner liner of the bag. One factor that could affect the rating of the ability of the bag to resist tears was the plate gap on the bag-sealing equipment. Data were collected on 19 bags in which the plate gap was varied.
1) Assuming a linear relationship, use the least-squares method to find the regression coefficients b0 and b1.
2) Interpret the meaning of the slope, b1, in this problem. Choose the correct answer below.
A. For each increase of one in the tear rating, the plate gap is expected to increase by b1 units.
B. The approximate tear rating when the plate gap is 0 units is b1.
C. The…
Chapter 5 Solutions
INTRODUCTION TO STATISTICS & DATA ANALYS
Ch. 5.1 - For each of the scatterplots shown, answer the...Ch. 5.1 - For each of the following pairs of variables,...Ch. 5.1 - For each of the following pairs of variables,...Ch. 5.1 - For each of the following pairs of variables,...Ch. 5.1 - Is the following statement correct? Explain why or...Ch. 5.1 - Draw a scatterplot for which r = 1.Ch. 5.1 - Draw a scatterplot for which r = 1.Ch. 5.1 - Each year J.D. Power and Associates surveys new...Ch. 5.1 - The accompanying data are x = Cost (cents per...Ch. 5.1 - The authors of the paper Flat-footedness Is Not a...
Ch. 5.1 - The paper The Relationship Between Cell Phone Use,...Ch. 5.1 - Data from the U.S. Federal Reserve Board (federal...Ch. 5.1 - The article 115K! The 13 Best Paying U.S....Ch. 5.1 - It may seem odd, but one of the ways biologists...Ch. 5.1 - An auction house released a list of 25 recently...Ch. 5.1 - A sample of automobiles traversing a certain...Ch. 5.2 - Two scatterplots are shown below. Explain why it...Ch. 5.2 - The authors of the paper Statistical Methods for...Ch. 5.2 - The accompanying data are a subset of data from...Ch. 5.2 - The authors of the paper Evaluating Existing...Ch. 5.2 - The authors of the paper referenced in the...Ch. 5.2 - A sample of 548 ethnically diverse students from...Ch. 5.2 - The relationship between hospital patient-to-nurse...Ch. 5.2 - The report Airline Quality Rating 2016...Ch. 5.2 - Acrylamide is a chemical that is sometimes found...Ch. 5.2 - Use the acrylamide data given in the previous...Ch. 5.2 - Studies have shown that people who suffer sudden...Ch. 5.2 - The data given in the previous exercise on x =...Ch. 5.2 - An article on the cost of housing in Califomia...Ch. 5.2 - The following data on sale price, size, and...Ch. 5.2 - Explain why it can be dangerous to use the...Ch. 5.2 - The sales manager of a large company selected a...Ch. 5.2 - Explain why the slope b of the least-squares line...Ch. 5.2 - Prob. 34ECh. 5.3 - Does it pay to stay in school? The report Trends...Ch. 5.3 - The data in the accompanying table is from the...Ch. 5.3 - The paper referenced in the previous exercise also...Ch. 5.3 - Consider the residual plot from the previous...Ch. 5.3 - The report Airline Quality Rating 2016...Ch. 5.3 - Acrylamide is a chemical that is sometimes found...Ch. 5.3 - Consider the scatterplot of acrylamide...Ch. 5.3 - Some types of algae have the potential to cause...Ch. 5.3 - The relationship between x = Total number of...Ch. 5.3 - The residuals from the least-squares line for the...Ch. 5.3 - The first Batman movie was made over 50 years ago...Ch. 5.3 - The article 115K! The 13 Best Paying U.S....Ch. 5.3 - The article Examined Life: What Stanley H. Kaplan...Ch. 5.3 - The accompanying data are a subset of data from...Ch. 5.3 - The article California State Parks Closure List...Ch. 5.3 - The article referenced in the previous exercise...Ch. 5.3 - A study was carried out to investigate the...Ch. 5.3 - Both r2 and se are used to assess the fit of a...Ch. 5.3 - Prob. 53ECh. 5.4 - The following data on x = Frying time (in seconds)...Ch. 5.4 - Use the information provided in the previous...Ch. 5.4 - The paper Aspects of Food Finding by Wintering...Ch. 5.4 - Food intake of grazing animals is limited by the...Ch. 5.4 - A study, described in the paper Prediction of...Ch. 5.4 - Prob. 59ECh. 5.4 - The following table gives the number of heart...Ch. 5.4 - Refer to the heart transplant data given in the...Ch. 5.4 - The paper Population Pressure and Agricultural...Ch. 5.4 - Determining the age of an animal can sometimes be...Ch. 5.5 - The paper How Lead Exposure Relates to Temporal...Ch. 5.5 - The following quote is from the paper Evaluation...Ch. 5 - The accompanying data represent x = Amount of...Ch. 5 - The paper A Cross-National Relationship Between...Ch. 5 - The following data on x = Score on a measure of...Ch. 5 - The paper Effects of Canine Parvovirus (CPV) on...Ch. 5 - The paper Depression, Body Mass Index, and Chronic...Ch. 5 - The paper Aspects of Food Finding by Wintering...Ch. 5 - Data on salmon availability (x) and the percentage...Ch. 5 - No tortilla chip lover likes soggy chips, so it is...Ch. 5 - The article Reduction is Soluble Protein and...Ch. 5 - The following quote is from the paper The Weight...Ch. 5 - An accurate assessment of oxygen consumption...Ch. 5 - Consider the four (x, y) pairs (0, 0), (1, 1), 1,...Ch. 5 - Prob. 1CRECh. 5 - Data from a survey of 1046 adults age 50 and older...Ch. 5 - Prob. 3CRECh. 5 - Prob. 4CRECh. 5 - Prob. 5CRECh. 5 - The amount of money spent each year on science,...Ch. 5 - Below are the data used to construct the time...Ch. 5 - In August 2009, Harris Interactive released the...Ch. 5 - Prob. 9CRECh. 5 - Prob. 10CRECh. 5 - Prob. 11CRECh. 5 - Prob. 12CRECh. 5 - Cost-to-charge ratios (the percentage of the...Ch. 5 - In the article Reproductive Biology of the Aquatic...Ch. 5 - Prob. 15CRECh. 5 - Anabolic steroid abuse has been increasing despite...Ch. 5 - Prob. 81ECh. 5 - Prob. 82ECh. 5 - Prob. 83ECh. 5 - Prob. 84ECh. 5 - Suppose the hypothetical data below are from a...Ch. 5 - Prob. 86E
Additional Math Textbook Solutions
Find more solutions based on key concepts
Use the following information to answer the next 14 exercises: The mean age for all Foothill College students f...
Introductory Statistics
31. Putting It Together: A Tornado Model Is the width of a tornado related to the amount of distance for which ...
Statistics: Informed Decisions Using Data (5th Edition)
In Exercises 9-20, use the data in the following table, which lists drive-thru order accuracy at popular fast f...
Elementary Statistics (13th Edition)
A father rates his daughter as a 2 on a 7-point scale (from 1 to 7) of crankiness. In this example, (a) what is...
Statistics for Psychology
(a) For each data set, find the mean, median, and mode. (b) Discuss anything about the data that affects the us...
APPLIED STAT.IN BUS.+ECONOMICS
Empirical versus Theoretical A Monopoly player claims that the probability of getting a 4 when rolling a six-si...
Introductory Statistics (2nd Edition)
Knowledge Booster


Learn more about
Need a deep-dive on the concept behind this application? Look no further. Learn more about this topic, statistics and related others by exploring similar questions and additional content below.Similar questions
- A coffee company uses a data-based approach to improving the quality and customer satisfaction of its products. When survey data indicated that the coffee company needed to improve its package-sealing process, an experiment was conducted to determine the factors in the bag-sealing equipment that might be affecting the ease of opening the bag without tearing the inner liner of the bag. One factor that could affect the rating of the ability of the bag to resist tears was the plate gap on the bag-sealing equipment. Data were collected on 19 bags in which the plate gap was varied. Assuming a linear relationship, use the least-squares method to find the regression coefficients b0 and b1. b0 = b1 =arrow_forwardA coffee company uses a data-based approach to improving the quality and customer satisfaction of its products. When survey data indicated that the coffee company needed to improve its package-sealing process, an experiment was conducted to determine the factors in the bag-sealing equipment that might be affecting the ease of opening the bag without tearing the inner liner of the bag. One factor that could affect the rating of the ability of the bag to resist tears was the plate gap on the bag-sealing equipment. Data were collected on 19 bags in which the plate gap was varied. A) Assuming a linear relationship, use the least-squares method to find the regression coefficients b0 and b1. Interpret the meaning of the slope, b1,in this problem. Choose the correct answer below. A.For each increase of one in the tear rating, the plate gap is expected to increase by b1 units. B. The approximate tear rating when the plate gap is 0 units is b1. C. The approximate…arrow_forwardWhen using the least-squares line for prediction, are results more reliable for extrapolation or interpolation? a. Interpolation, because we are predicting from data outside the range used to create the least-squares line. b. Extrapolation, because we are predicting from data outside the range used to create the least-squares line. c. Extrapolation, because we are predicting from data in the range used to create the least-squares line. d. Interpolation, because we are predicting from data in the range used to create the least-squares line.arrow_forward
- Researchers at Purdue University and Wichita State University found that airlines are doing a better job of getting passengers to their destinations on time. AirTran Airways and Southwest Airlines were among the leaders in on-time arrivals, with both having 88% of their flights arriving on time. But for the 12% of flights that were delayed, the dataset named AirDelay contains this information. - View the infotmation (data that realtes to the question) in the screenshot attatched. A) Formulate the hypothesis that can be used to test for a difference between the population mean minutes late for delayed flights by these two airlines. B) Identify the appropriate t-test. Explain your selection. C)Conduct the test using an α = .05. D) Interpret your results in the context of this problem.arrow_forwardA sociologist recorded the number of contacts entered in a cell phone and the number of texts sent in a week for 20 cell phone users. The resulting data were used to conduct a hypothesis test to investigate whether there is a linear relationship between the number of contacts and the number of texts sent. What are the correct hypotheses for the test?arrow_forwardThe table below shows the numbers of bushels of barley cultivated per acre for 12 one-acre plots of land for two different strains of barley, PHT-34 and CBX-21. PHT-34 CBX-21 43 55 49 46 47 43 38 44 47 45 45 49 50 47 46 59 46 52 46 49 45 48 43 51 Determine the minimum data value, the quartiles, and the maximum data value for the PHT-34 and CBX-21 data sets. PHT-34 CBX-21 min Q1 Q2 Q3 maxarrow_forward
- Do less agreeable Facebook users tend to spend more time on Facebook? A study (Ivcevic and Ambady, 2013) aimed to investigate various facets of use of the social networking website Facebook. Previous research suggested that individuals with poorer face-to-face social skills may find internet-based social platforms less daunting, so as part of the study Ivcevic and Ambady investigated whether an individual's volume of Facebook use was associated with levels of "agreeableness". The subjects were 99 university students who all had a Facebook page. The subjects agreed to allowing the content of their Facebook pages to be downloaded on six separate occasions over a three-week period. As part of the data gathered on each subject, each of the 99 were individually rated by a selected friend on an "agreeableness" scale (based on average ratings on a questionnaire where all responses were on a Likert scale), with 1 being "low" and 5 "high". We consider here the relationship between "friend…arrow_forwardDo less agreeable Facebook users tend to spend more time on Facebook? A study (Ivcevic and Ambady, 2013) aimed to investigate various facets of use of the social networking website Facebook. Previous research suggested that individuals with poorer face-to-face social skills may find internet-based social platforms less daunting, so as part of the study Ivcevic and Ambady investigated whether an individual's volume of Facebook use was associated with levels of "agreeableness". The subjects were 99 university students who all had a Facebook page. The subjects agreed to allowing the content of their Facebook pages to be downloaded on six separate occasions over a three-week period. As part of the data gathered on each subject, each of the 99 were individually rated by a selected friend on an "agreeableness" scale (based on average ratings on a questionnaire where all responses were on a Likert scale), with 1 being "low" and 5 "high". We consider here the relationship between "friend…arrow_forwardOf all sports, football accounts for the highest incidence of concussion in the United States due to the large number of athletes participating and the nature of the sport. While there is general agreement that concussion incidence can be reduced by making rule changes and teaching proper tackling technique, there remains debate as to whether helmet design may also reduce the incidence of concussion. Rowson et al. (2014) report on a retrospective analysis of head impact data collected between 2005 and 2010 from eight collegiate football teams. Concussion rates for players wearing two types of helmets, Riddell VSR4 and Riddell Revolution, were compared. A total of 1,281,444 head impacts were recorded, from which 64 concussions were diagnosed. The relative risk of sustaining a concussion in a Revolution helmet compared with a VSR4 helmet was 46.1%. This study illustrates that differences in the ability to reduce concussion risk exist between helmet models in football. Although helmet…arrow_forward
- The purchase value of transactions at a grocery store is normally distributed with a mean of $244 and a variance of 4624 ($squared). What is the maximum purchase value of transactions for the lowest-spending 33% of grocery store customers?arrow_forwardAccording to the World Health Organization, obesity has reached epidemic proportions globally. While obesity has generally been linked with chronic disease and disability, researchers argue that it may also affect wages. In other words, the body mass index (BMI) of an employee is a predictor for salary. (A person is considered overweight if his/her BMI is at least 25 and obese if BMI exceeds 30.) The accompanying data file includes salary (in $1,000s) for 30 college-educated men with their respective BMI and a dummy variable that represents 1 for a white man and 0 otherwise. Salary BMI White 34 33 1 43 26 1 44 26 1 34 35 0 34 36 1 53 20 1 42 20 0 37 26 1 35 28 1 46 22 1 46 20 1 34 35 0 45 26 1 33 34 0 25 29 0 32 30 1 46 18 0 31 31 0 54 19 1 37 23 0 42 27 1 38 30 1 45 18 0 38 26 0 41 28 1 39 28 1 50 20 1 41 26 1 38 28 1 45 21 1 1. Estimate a model for Salary with BMI and White as the predictor variables. Note: Negative…arrow_forwardA researcher notes that there seems to be a difference in the prevalence of individuals who are medication adherent and have high levels of education along with a high health literacy and the prevalence of individuals who are not medication adherent and have low levels of education along with a low health literacy. Use the appropriate hypothesis to determine if education level and health literacy status are related (independent) at the 5%. Low Level of Education Low Medication Adherence High Medication Adherence Total Low Health Literacy 91 9 100 High Health Literacy 9 291 300 Total 100 300 400 High Level of Education Low Medication Adherence High Medication Adherence Total Low Health Literacy 96 4 100 High Health Literacy 4 296 300 Total 100 300 400arrow_forward
arrow_back_ios
SEE MORE QUESTIONS
arrow_forward_ios
Recommended textbooks for you
 Linear Algebra: A Modern IntroductionAlgebraISBN:9781285463247Author:David PoolePublisher:Cengage Learning
 Glencoe Algebra 1, Student Edition, 9780079039897...AlgebraISBN:9780079039897Author:CarterPublisher:McGraw Hill
 Big Ideas Math A Bridge To Success Algebra 1: Stu...AlgebraISBN:9781680331141Author:HOUGHTON MIFFLIN HARCOURTPublisher:Houghton Mifflin Harcourt
Linear Algebra: A Modern Introduction
Algebra
ISBN:9781285463247
Author:David Poole
Publisher:Cengage Learning
Glencoe Algebra 1, Student Edition, 9780079039897...
Algebra
ISBN:9780079039897
Author:Carter
Publisher:McGraw Hill
Big Ideas Math A Bridge To Success Algebra 1: Stu...
Algebra
ISBN:9781680331141
Author:HOUGHTON MIFFLIN HARCOURT
Publisher:Houghton Mifflin Harcourt
Correlation Vs Regression: Difference Between them with definition & Comparison Chart; Author: Key Differences;https://www.youtube.com/watch?v=Ou2QGSJVd0U;License: Standard YouTube License, CC-BY
Correlation and Regression: Concepts with Illustrative examples; Author: LEARN & APPLY : Lean and Six Sigma;https://www.youtube.com/watch?v=xTpHD5WLuoA;License: Standard YouTube License, CC-BY