INTRODUCTION TO STATISTICS & DATA ANALYS
6th Edition
ISBN: 9780357420447
Author: PECK
Publisher: CENGAGE L
bartleby

Videos

Question
Book Icon
Chapter 5, Problem 86E

a.

To determine

Draw the scatterplot of the proportion of failing versus the load on the fabric.

a.

Expert Solution
Check Mark

Answer to Problem 86E

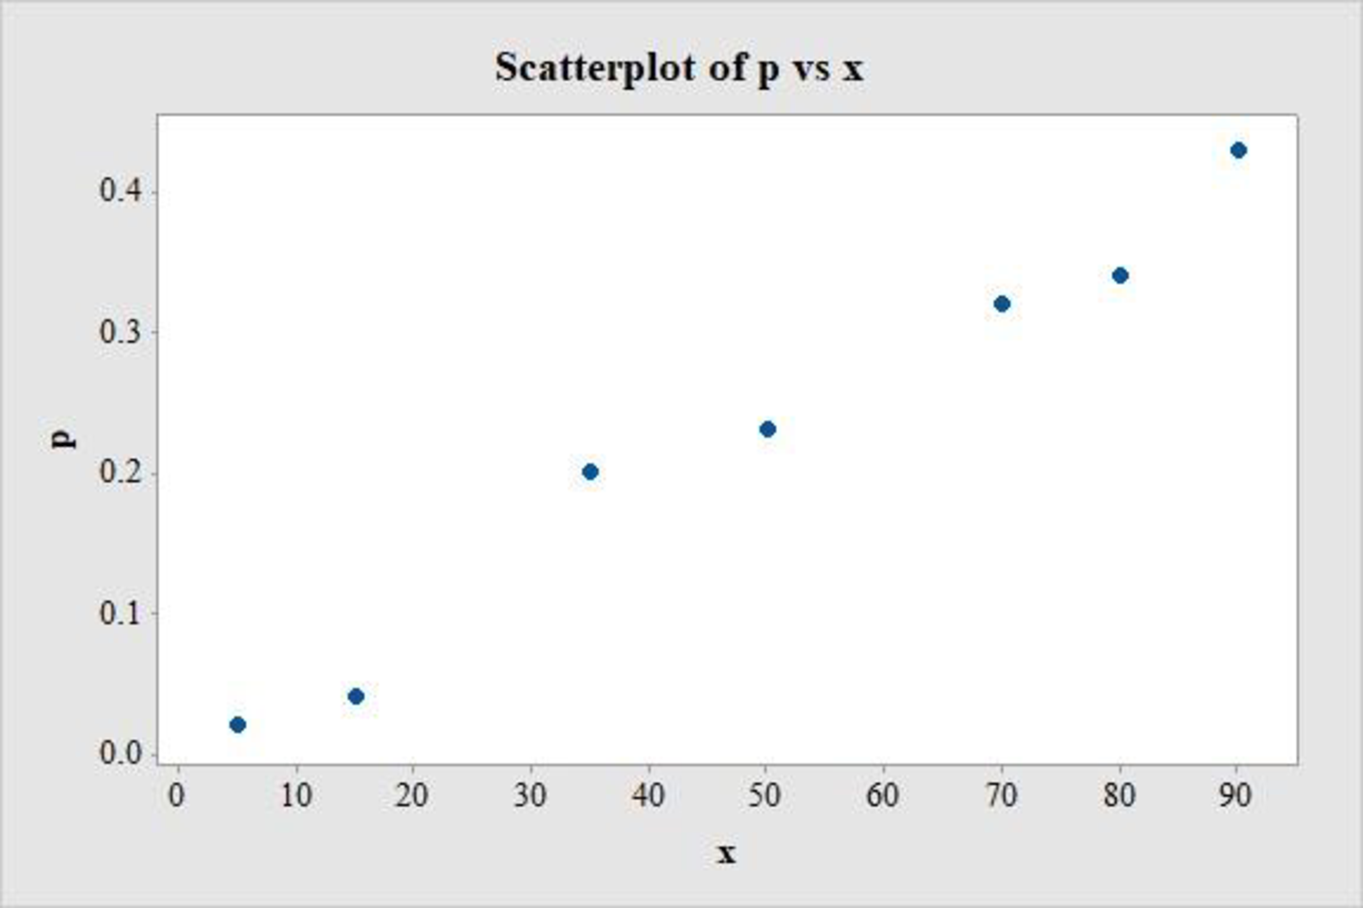
The scatterplot of the proportion of failing versus the load on the fabric is as follows:

INTRODUCTION TO STATISTICS & DATA ANALYS, Chapter 5, Problem 86E , additional homework tip  1

Explanation of Solution

Calculation:

The given data relates the proportion of times a fabric fails, or causes a “wardrobe malfunction” with the load or force applied on it (lb/sq in.).

Denote the proportion of times a fabric fails as p and the load as x.

Scatterplot:

Software procedure:

Step-by-step procedure to draw the scatterplot using MINITAB software is given below:

  • Choose Graph > Scatterplot.
  • Choose Simple, and then click OK.
  • Enter the column of p under Y variables.
  • Enter the column of x under X variables.
  • Click OK in all dialogue boxes.

Thus, the scatterplot for the data is obtained.

b.

To determine

Find the value of y=ln(p1p) for each load.

Fit a regression line of the form y=a+b(Load).

Describe the significance of the positive slope.

b.

Expert Solution
Check Mark

Answer to Problem 86E

The regression line fitted to the given data is y=1.5130.5872x_.

Explanation of Solution

Calculation:

Logistic regression:

The logistic regression equation for the prediction of a probability for the given value of the explanatory variable, x, is p^=ea+bx1+ea+bx, for constants a and b. For the logistic regression, y=ln(p1p) has a linear relationship with x, by the relation: y=a+bx.

The values of y=ln(p1p) can be obtained using software. Now, the proportion of failure of a fabric is p. In MINITAB, denote the column of y as y*, so that y*=ln(p1p).

Data transformation y*=ln(p1p):

Software procedure:

Step-by-step procedure to transform the data using MINITAB software is given below:

  • Choose Calc > Calculator.
  • Enter the column of y* under Store result in variable.
  • Enter the formula LN(‘p’/(1–‘p’)) under Expression.
  • Click OK.

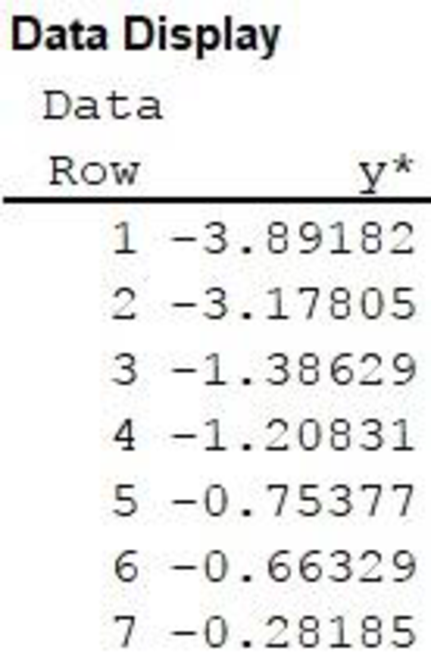
The transformed variable is stored in the column y*.

Data display:

Software procedure:

Step by step procedure to display the data using MINITAB software is given as,

  • Choose Data > Display Data.
  • Under Column, constants, and matrices to display, enter the column of y*.
  • Click OK on all dialogue boxes.

The output using MINITAB software is given as follows:

INTRODUCTION TO STATISTICS & DATA ANALYS, Chapter 5, Problem 86E , additional homework tip  2

Regression equation:

Software procedure:

Step by step procedure to obtain the regression equation using the MINITAB software:

  • Choose Stat > Regression > Regression > Fit Regression Model.
  • Enter the column of y* under Responses.
  • Enter the columns of x under Continuous predictors.
  • Choose Results and select Analysis of Variance, Model Summary, Coefficients, Regression Equation.
  • Click OK in all dialogue boxes.

Output obtained using MINITAB is given below:

INTRODUCTION TO STATISTICS & DATA ANALYS, Chapter 5, Problem 86E , additional homework tip  3

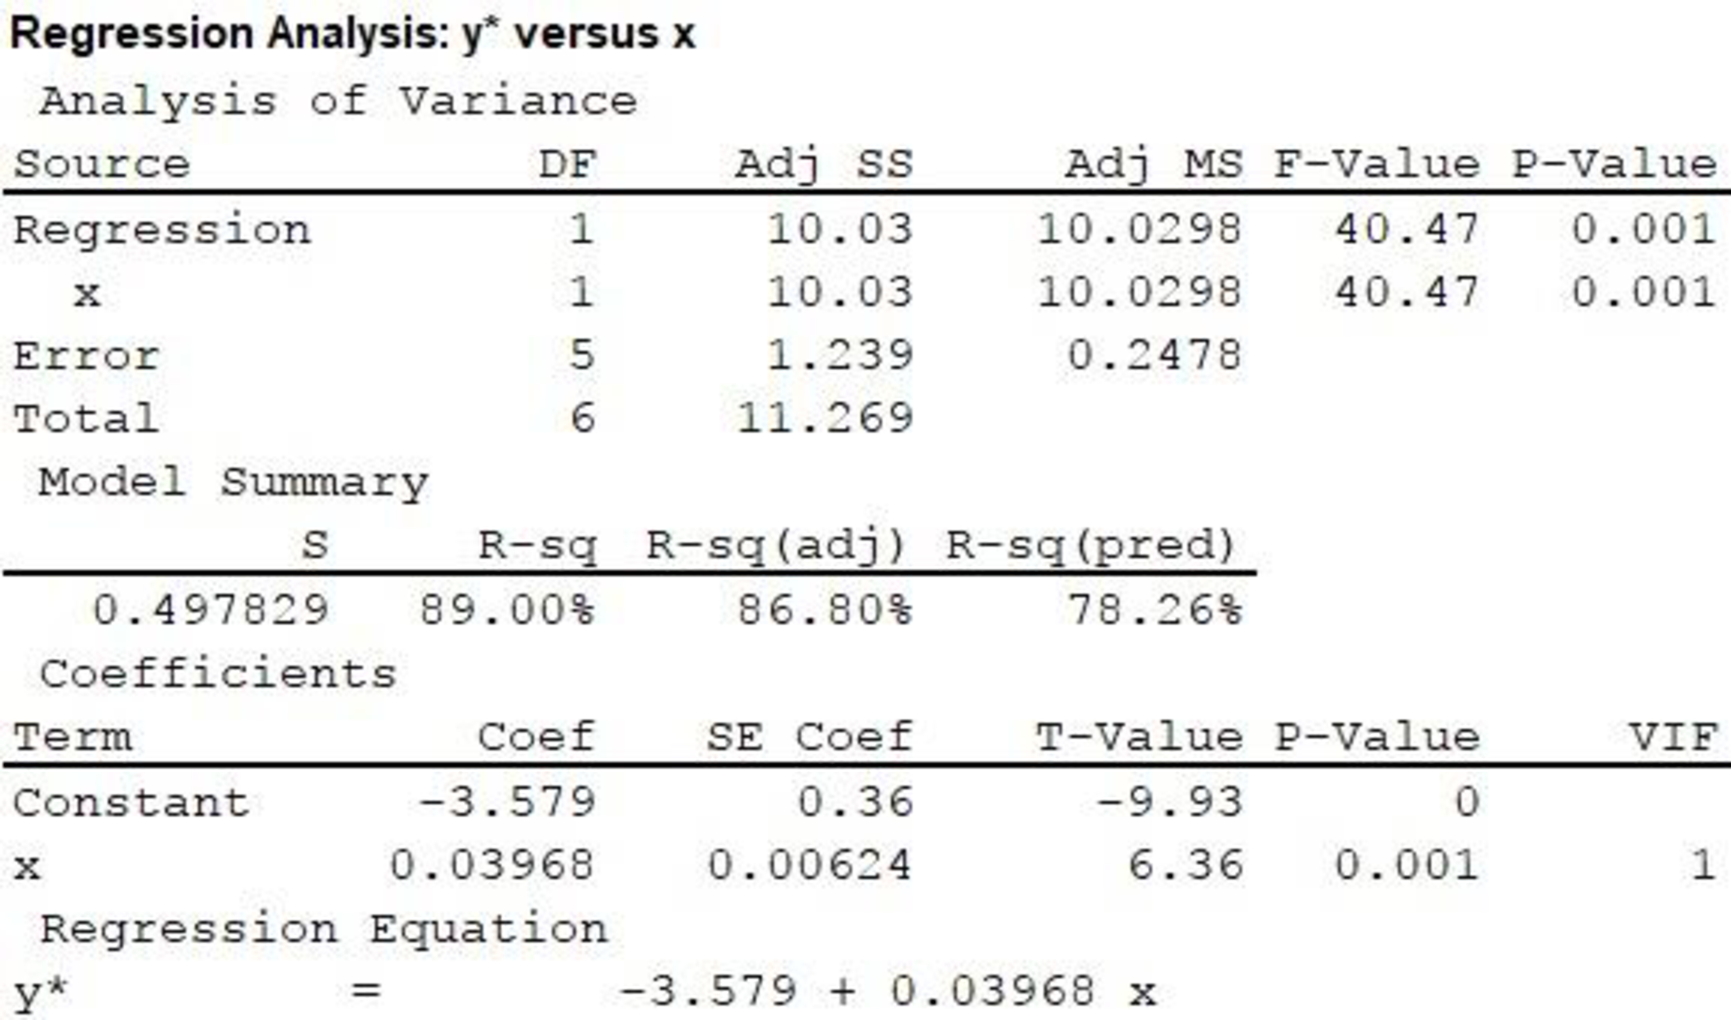
In the output, substituting y*=y[=ln(p1p)], the regression equation of the given form is y=3.579+0.03968x_.

It is observed that the slope of x is 0.03968, which is positive. A positive slope implies that an increase in x causes an increase in yꞌ.

Now, it is known that the quantity p1p is the odds of failure of a fabric, for a given load and y=ln(p1p) is the natural logarithm of odds. Moreover, it is known that logarithm is an increasing function of the variable.

In this case, an increase in load increases the natural logarithm of odds of failure, which, in turn, implies an increase in the odds of failure.

Thus, the positive slope implies that an increase in load causes an increase in the odds of failure of a fabric.

c.

To determine

Predict the proportion of failure of a fabric, for a load of 60 lb/sq in.

c.

Expert Solution
Check Mark

Answer to Problem 86E

The proportion of failure of a fabric, for a load of 60 lb/sq in. is 0.2318.

Explanation of Solution

Calculation:

For a load of 60 lb/sq in., substitute x=60 in the logistic equation:

y=3.579+0.03968xln(p^1p^)=3.579+0.03968x=3.579+(0.03968×60)=3.579+2.3808=1.1982

Thus,

p^1p^=e1.19820.3017.1p^p^=10.30171p^13.3141

    1p^=1+3.3141=4.3141p^=14.31410.2318.

Thus, the proportion of failure of a fabric, for a load of 60 lb/sq in. is 0.2318.

d.

To determine

Estimate the maximum safe load to have a less than 5% chance of failing or wardrobe malfunction.

d.

Expert Solution
Check Mark

Answer to Problem 86E

The maximum safe load to have a less than 5% chance of failing or wardrobe malfunction is 16 lb/sq in.

Explanation of Solution

Calculation:

For a 5% chance of failing, p^=0.05(=5100). Substitute this value in the logistic equation:

y=3.579+0.03968xln(p^1p^)=3.579+0.03968xln(0.0510.05)=3.579+0.03968xln(0.050.95)=3.579+0.03968xln(0.0526)3.579+0.03968x2.9444=3.579+0.03968x.

Thus,

0.03968x=2.9444+3.579=0.6346x=0.63460.0396815.9916.

As a result, the load for a proportion of failure of 0.05 is 16 lb/sq in.

Now, from the explanation in Part b, an increase in the load causes an increase in the odds of failure. Thus, an increase in load from 16 lb/sq in. would cause an increase in the proportion of failure, whereas a decrease in load from 16 lb/sq in. would cause a decrease in the proportion of failure.

Thus, the maximum safe load to have a less than 5% chance of failing or wardrobe malfunction is 16 lb/sq in.

Want to see more full solutions like this?

Subscribe now to access step-by-step solutions to millions of textbook problems written by subject matter experts!

Chapter 5 Solutions

INTRODUCTION TO STATISTICS & DATA ANALYS

Ch. 5.1 - The paper The Relationship Between Cell Phone Use,...Ch. 5.1 - Data from the U.S. Federal Reserve Board (federal...Ch. 5.1 - The article 115K! The 13 Best Paying U.S....Ch. 5.1 - It may seem odd, but one of the ways biologists...Ch. 5.1 - An auction house released a list of 25 recently...Ch. 5.1 - A sample of automobiles traversing a certain...Ch. 5.2 - Two scatterplots are shown below. Explain why it...Ch. 5.2 - The authors of the paper Statistical Methods for...Ch. 5.2 - The accompanying data are a subset of data from...Ch. 5.2 - The authors of the paper Evaluating Existing...Ch. 5.2 - The authors of the paper referenced in the...Ch. 5.2 - A sample of 548 ethnically diverse students from...Ch. 5.2 - The relationship between hospital patient-to-nurse...Ch. 5.2 - The report Airline Quality Rating 2016...Ch. 5.2 - Acrylamide is a chemical that is sometimes found...Ch. 5.2 - Use the acrylamide data given in the previous...Ch. 5.2 - Studies have shown that people who suffer sudden...Ch. 5.2 - The data given in the previous exercise on x =...Ch. 5.2 - An article on the cost of housing in Califomia...Ch. 5.2 - The following data on sale price, size, and...Ch. 5.2 - Explain why it can be dangerous to use the...Ch. 5.2 - The sales manager of a large company selected a...Ch. 5.2 - Explain why the slope b of the least-squares line...Ch. 5.2 - Prob. 34ECh. 5.3 - Does it pay to stay in school? The report Trends...Ch. 5.3 - The data in the accompanying table is from the...Ch. 5.3 - The paper referenced in the previous exercise also...Ch. 5.3 - Consider the residual plot from the previous...Ch. 5.3 - The report Airline Quality Rating 2016...Ch. 5.3 - Acrylamide is a chemical that is sometimes found...Ch. 5.3 - Consider the scatterplot of acrylamide...Ch. 5.3 - Some types of algae have the potential to cause...Ch. 5.3 - The relationship between x = Total number of...Ch. 5.3 - The residuals from the least-squares line for the...Ch. 5.3 - The first Batman movie was made over 50 years ago...Ch. 5.3 - The article 115K! The 13 Best Paying U.S....Ch. 5.3 - The article Examined Life: What Stanley H. Kaplan...Ch. 5.3 - The accompanying data are a subset of data from...Ch. 5.3 - The article California State Parks Closure List...Ch. 5.3 - The article referenced in the previous exercise...Ch. 5.3 - A study was carried out to investigate the...Ch. 5.3 - Both r2 and se are used to assess the fit of a...Ch. 5.3 - Prob. 53ECh. 5.4 - The following data on x = Frying time (in seconds)...Ch. 5.4 - Use the information provided in the previous...Ch. 5.4 - The paper Aspects of Food Finding by Wintering...Ch. 5.4 - Food intake of grazing animals is limited by the...Ch. 5.4 - A study, described in the paper Prediction of...Ch. 5.4 - Prob. 59ECh. 5.4 - The following table gives the number of heart...Ch. 5.4 - Refer to the heart transplant data given in the...Ch. 5.4 - The paper Population Pressure and Agricultural...Ch. 5.4 - Determining the age of an animal can sometimes be...Ch. 5.5 - The paper How Lead Exposure Relates to Temporal...Ch. 5.5 - The following quote is from the paper Evaluation...Ch. 5 - The accompanying data represent x = Amount of...Ch. 5 - The paper A Cross-National Relationship Between...Ch. 5 - The following data on x = Score on a measure of...Ch. 5 - The paper Effects of Canine Parvovirus (CPV) on...Ch. 5 - The paper Depression, Body Mass Index, and Chronic...Ch. 5 - The paper Aspects of Food Finding by Wintering...Ch. 5 - Data on salmon availability (x) and the percentage...Ch. 5 - No tortilla chip lover likes soggy chips, so it is...Ch. 5 - The article Reduction is Soluble Protein and...Ch. 5 - The following quote is from the paper The Weight...Ch. 5 - An accurate assessment of oxygen consumption...Ch. 5 - Consider the four (x, y) pairs (0, 0), (1, 1), 1,...Ch. 5 - Prob. 1CRECh. 5 - Data from a survey of 1046 adults age 50 and older...Ch. 5 - Prob. 3CRECh. 5 - Prob. 4CRECh. 5 - Prob. 5CRECh. 5 - The amount of money spent each year on science,...Ch. 5 - Below are the data used to construct the time...Ch. 5 - In August 2009, Harris Interactive released the...Ch. 5 - Prob. 9CRECh. 5 - Prob. 10CRECh. 5 - Prob. 11CRECh. 5 - Prob. 12CRECh. 5 - Cost-to-charge ratios (the percentage of the...Ch. 5 - In the article Reproductive Biology of the Aquatic...Ch. 5 - Prob. 15CRECh. 5 - Anabolic steroid abuse has been increasing despite...Ch. 5 - Prob. 81ECh. 5 - Prob. 82ECh. 5 - Prob. 83ECh. 5 - Prob. 84ECh. 5 - Suppose the hypothetical data below are from a...Ch. 5 - Prob. 86E
Knowledge Booster
Background pattern image
Statistics
Learn more about
Need a deep-dive on the concept behind this application? Look no further. Learn more about this topic, statistics and related others by exploring similar questions and additional content below.
Recommended textbooks for you
Text book image
College Algebra
Algebra
ISBN:9781305115545
Author:James Stewart, Lothar Redlin, Saleem Watson
Publisher:Cengage Learning
Text book image
College Algebra
Algebra
ISBN:9781938168383
Author:Jay Abramson
Publisher:OpenStax
Text book image
Mathematics For Machine Technology
Advanced Math
ISBN:9781337798310
Author:Peterson, John.
Publisher:Cengage Learning,
Text book image
Algebra & Trigonometry with Analytic Geometry
Algebra
ISBN:9781133382119
Author:Swokowski
Publisher:Cengage
Text book image
College Algebra (MindTap Course List)
Algebra
ISBN:9781305652231
Author:R. David Gustafson, Jeff Hughes
Publisher:Cengage Learning
Implicit Differentiation with Transcendental Functions; Author: Mathispower4u;https://www.youtube.com/watch?v=16WoO59R88w;License: Standard YouTube License, CC-BY
How to determine the difference between an algebraic and transcendental expression; Author: Study Force;https://www.youtube.com/watch?v=xRht10w7ZOE;License: Standard YouTube License, CC-BY